


Table Of Contents

Abstract
This study empirically investigates the sustainable environment in Lebanon. In this context, the study uses ecological footprint (EFP) as the leading environmental proxy, while load capacity factor (LCF) is used for the robustness check. Also, the study considers some critical factors (namely, income, population, disaggregated level electricity consumption, and energy transition) as the explanatory variables, applies a marginal effect analysis through the Kernel-Based Least Squares (KRLS) approach, and uses data between 2000 and 2022. The empirical results show that (i) a 1% increase in income, population, hydroelectricity, and energy transition causes a 0.09%, 0.17%, 0.03%, and 0.80% increase in EFP, in order; (ii) fossil and renewable electricity consumption do not have a statistically significant effect; (iii) almost all variables considered have a varying marginal effect across percentiles; (iv) the KRLS results have a higher estimation capacity around 96.7%; (v) the empirical results are robust in case of alternative indicator (i.e., LCF) use. Thus, the study highlights the factors' marginal and percentile-based differentiating effects, while only hydroelectricity has a declining effect on environmental degradation. Considering the results, the study discusses policy options for Lebanon in ensuring a sustainable environment.
Introduction
Grossman and Krueger (1991) constitute a theoretical background for the relationship between economic and environmental structure. According to their framework, which is called the EKC hypothesis, there is a strict relationship between economic growth structure and environmental sustainability. In addition to this leading study, Kraft and Kraft (1978) theorize the relationship between energy use and economic growth. Following these pioneering and leading studies, various studies (e.g., Rzayeva & Huseynova, 2025) have investigated the relationship between the economy, energy, and environment. In this context, a set of factors, either dependent or explanatory variables, have been considered in previous studies in the literature.
While the previous studies (e.g., Lantz & Feng, 2006; Begum et al., 2015; Dogan & Turkekul, 2016; Yu et al., 2018; Mahmood et al., 2023) considered mainly GDP, population, and fossil energy variables for environmental examination, the most recent studies (e.g., Hasanov et al., 2023; Lau et al., 2023; Abbasi et al., 2024; Kazemzadeh et al., 2024; Qi et al., 2024) have considered new factors, such as clean energy and energy transition. In addition to this perspective, the literature on environmental proxies has also been developing. While previous studies (e.g., Balsalobre-Lorente et al., 2024; Taher, 2024) used mainly carbon dioxide (CO2) emissions as environmental indicator, the most recent studies (e.g., Ramezani et al., 2022; Duran & Saqib, 2024; Kartal, 2024; Özcan et al., 2024; Yang et al., 2024) have used either EFP or LCF as the proxy of environmental sustainability. Accordingly, literature on environmental and energy economics has been developing.
The studies in the contemporary literature have considered various country cases or country groups. A group of studies (e.g., Dogan & Turkekul, 2016; Abbasi et al., 2024; Duran & Saqib, 2024; Kartal, 2024) has focused on mainly developing country cases. On the other hand, some countries (e.g., Nathaniel et al., 2021; Ramezani et al., 2022) have preferred to focus on developing or underdeveloped countries due to their non-developed status.
It is noteworthy that the number of studies investigating the effects of renewable energy on Lebanon is relatively low in the empirical research (e.g., Dagher & Yacoubian, 2012; Nathaniel et al., 2021; Ramezani et al., 2022; Taher, 2024). However, the essential finding of these studies is that using renewable energy reduces environmental pollution and positively contributes to economic growth in Lebanon. Dagher and Yacoubian (2012) probe the causal relationship between energy consumption and short- and long-term growth with data from 1980-2009. Nathaniel et al. (2021) prove that using renewable energy in Lebanon reduced EFP with FMOLS and DOLS results. Ramezani et al. (2022) also reveal that using renewable energy reduced EFP in their evaluation of MENA countries with data from 2000-2016. Taher (2024) analyzes that renewable energy consumption positively affected economic growth in his study using the ARDL model method using data from 1990-2022 for Lebanon. While each focus is valuable in the search for solutions to combat environmental problems, in the belief of this research it is much more appropriate to focus on developing/underdeveloped countries because the economic growth and energy mix structure of such countries are not highly eco-friendly. Considering this point of view, this study focuses on Lebanon, a key country in the MENA region. Figure 1 presents the progress of environmental indicators in Lebanon.
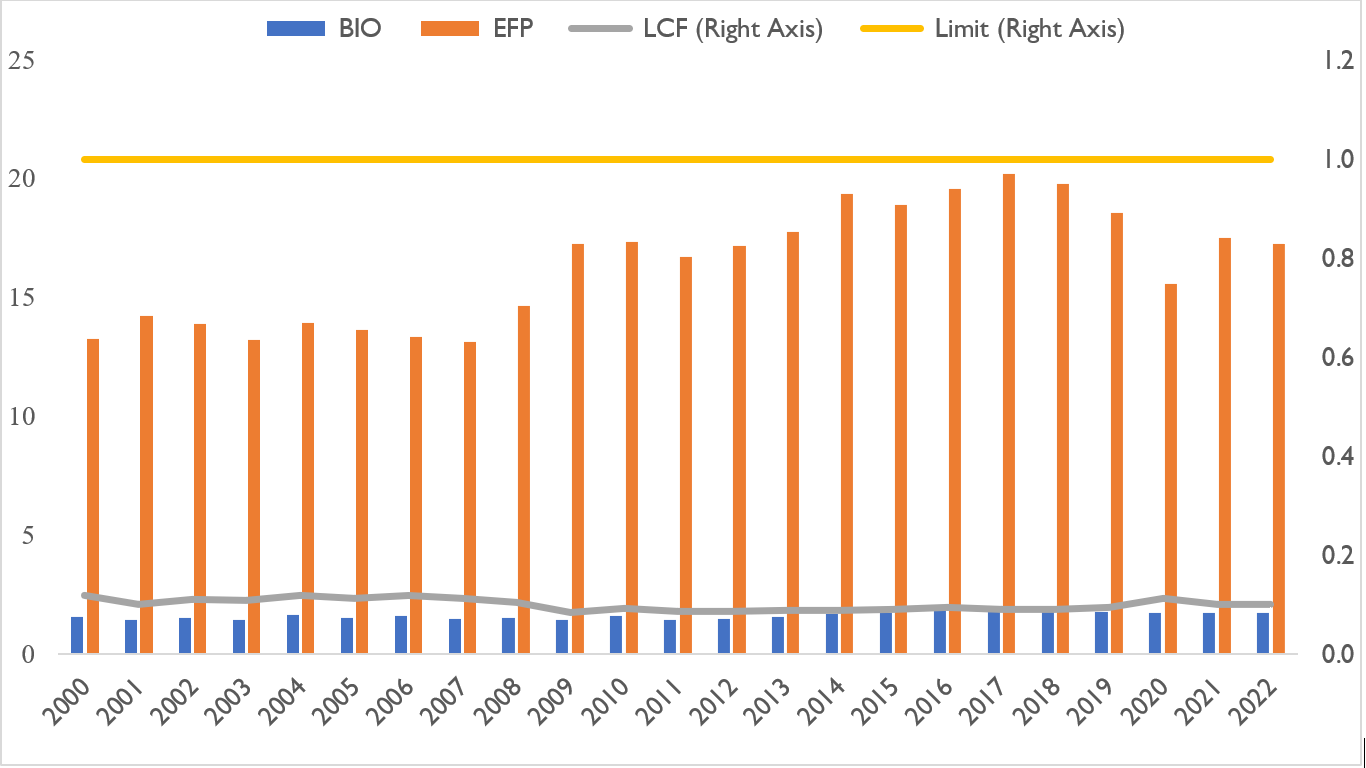
As demonstrated in Figure 1, there has been a high level of EFP across the years. On the other hand, BIO, which represents the ecological capacity to absorb the human-induced effect, has been at quite a low level concerning EFP across the years. Consequently, the environmental quality proxied by LCF has been less than the "1" point, reflecting the environmental sustainability limit, where BIO is equal to EFP. In this way, Figure 1 reflects that Lebanon has an unsustainable environmental condition, which requires immediate action.
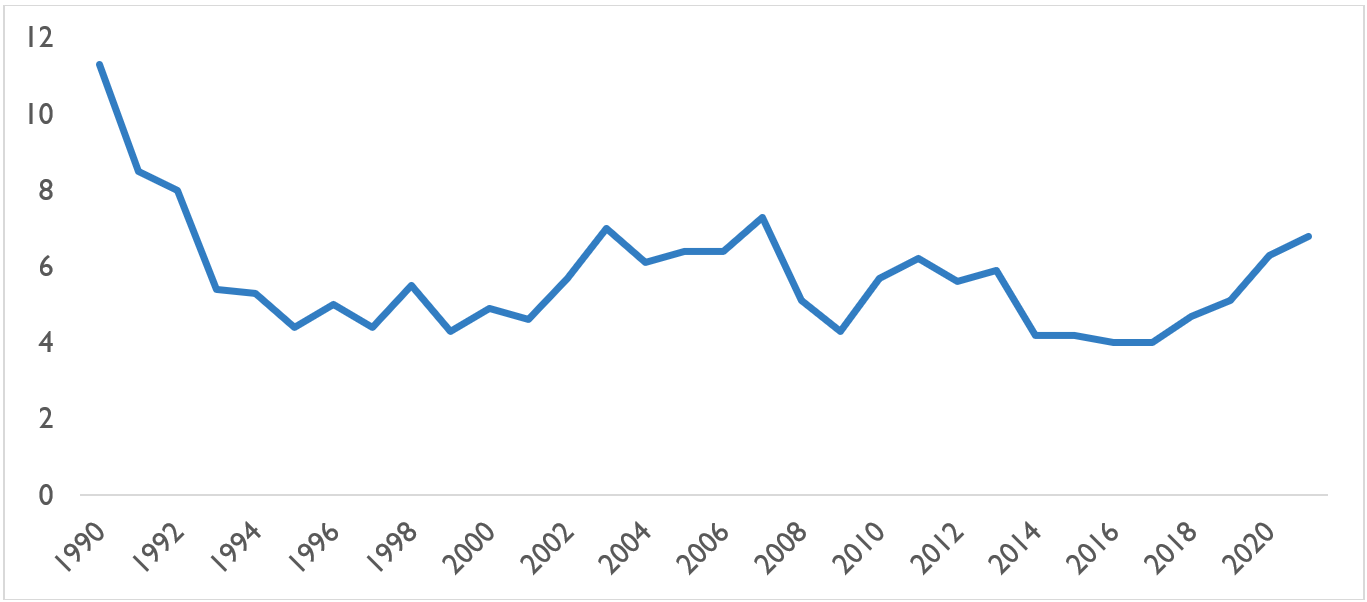
According to Figure 2, it is noteworthy that the share of REC in Lebanon’s total energy consumption has been on a downward trend since the 1990s, falling from around 12% to 4%. Notably, the increase in demand for renewable energy use, as in the rest of the world, has created similar effects in Lebanon, as it has in the past after it started to increase again after 2017. However, due to the economic crisis and political environment that Lebanon has experienced recently, the share that can be allocated for investment and R&D expenditures for REC has narrowed, causing Lebanon to postpone renewable energy investments or not benefit sufficiently from these opportunities.
IRENA (2020)’s report on the use of renewable energy in Lebanon, it is noted that the share of oil products (96%), solar and wind (1%), biofuels and waste (1%), Coal (2%), hydroelectricity production capacity in the total is 1% and low. There is primarily natural gas (41%), Gasoline (25%), and oil-based (23%) energy production. IRENA (2020) aims to increase the hydropower production capacity, which is 331.5 MW in 2020, to 473 MW in 2030. These statistics show and align with this study's empirical findings. It is necessary to increase the share of HEC consumption in total energy consumption in Lebanon and carry out essential investment moves.
In the recent literature, various studies include the Lebanon case (e.g., Nathaniel et al., 2021; Ramezani et al., 2022; Song & Uprasen, 2024; Taher, 2024). Also, marginal effect analysis has been applied in the recent literature (e.g., Taskın et al., 2024). However, based on the best knowledge, no study focuses on Lebanon by applying a marginal effect analysis to uncover environmental sustainability or considering critical factors using the most recent available data.
Considering the literature gap, this study empirically examines Lebanon's environmental sustainability by performing a marginal effect analysis. The study uses EFP and LCF as environmental indicators, while GDP, POP, FEC, HEC, REC, and ETI are explanatory variables. Moreover, the study uses data between 2000 and 2022 and performs the KRLS approach for empirical analysis. In this way, the study investigates the marginal effects of the aforementioned factors on environmental sustainability in Lebanon by considering also percentiles of the factors, where the effects may vary across percentiles.
Following up on the above-explained approach, the study reveals that only HEC supports environmental sustainability in Lebanon. Other factors have either insignificant or harmful effects on the environment. Moreover, the effects of the factors have a differentiating structure across percentiles. Furthermore, the KRLS approach has a higher estimation capacity. In this way, the study closes the literature gap by providing fresh insights from Lebanon by ensuring some novelties, such as handling the Lebanon case by performing the KRLS approach for the first time, including disaggregated level EC and ETI together, and considering the percentile-based varying effect of the factors.
The following study sections will be discussed: Section 2 explains the methods, Section 3 presents the results, and Section 4 concludes.
Methods
Data and Variables
This study investigates the marginal effects of critical factors on the sustainable environment in Lebanon. In this context, the study uses EFP as the primary environmental indicator (Kartal et al., 2025) and considers LCF for the robustness check (Kartal et al., 2025). Also, the study uses a set of explanatory factors (namely, GDP, POP, FEC, HEC, REC, & ETI) to uncover the marginal effects of these factors on environmental sustainability by applying a marginal effect analysis.
Data for EFP and LCF is gathered from (GFN, 2025). Also, data for GDP is collected from WB (2025). Moreover, data on POP, FEC, HEC, and REC is taken from Our World in Data (2025), while data on ETI is obtained from (UNCTAD, 2025). Table 1 presents the key details of the variables.
| Symbol | Definition | Unit | Data Source |
|---|---|---|---|
| EFP | Ecological Footprint* | Global hectares | |
| LCF | Load Capacity Factor** | BIO/EFP | GFN (2025) |
| GDP | Gross Domestic Product | Constant USD | WB (2025) |
| POP | Population | Person | |
| FEC | Fossil Electricity | Our World in Data (2025) | |
| HEC | Hydro Electricity | Terawatt-hours | |
| REC | Renewable Electricity | ||
| ETI | Energy Transition Index | Basis Point | UNCTAD (2025) |
Notes: * and ** denote the primary and alternative dependent variables in order.
The estimation equations used in the study are as follows:
\begin{split} EFP = \rho_0 &+ \gamma_1 lngdp + \gamma_2 lnpop + \gamma_3 lnfec + \gamma_4 lnhec + \gamma_5 lnrec +\gamma_6 lneti + \varepsilon_{it} \end{split}(1)
\begin{split} LCF = \rho_0 &+ \gamma_1 lngdp + \gamma_2 lnpop + \gamma_3 lnfec + \gamma_4 lnhec + \gamma_5 lnrec +\gamma_6 lneti + \varepsilon_{it} \end{split}(2)
The models shown in Equations Equation (1) and Equation (2) will be investigated empirically according to the variables explained in Table 1. The study consists of yearly data for the variables between 2000 and 2022 because data on ETI ends in 2022. Following the collection of raw data from the data sources, as summarized in Table 1, the study applies logarithmic differences to account for elasticities in uncovering the marginal effect as compatible with the recent literature (e.g., Kartal & Pata, 2023).
Empirical Procedure
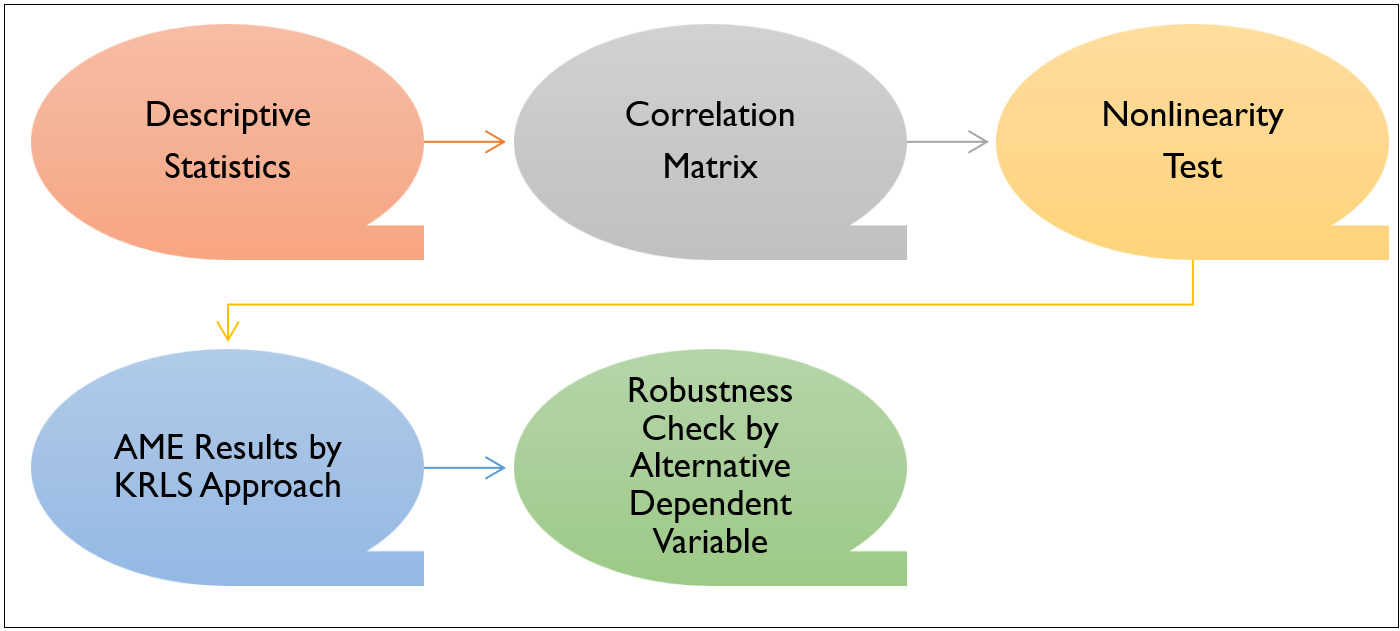
In empirically investigating the marginal effect of the factors considered on environmental sustainability in Lebanon, the research applies the empirical process, which is presented in Figure 3.
Empirical Results
Preliminary Statistics
Among the initial steps of the empirical process, the study first examines the preliminary statistics of the variables. Table 2 demonstrates the descriptive statistics.
| Variable | Mean | Median | Maximum | Minimum | SD | JB | Prob. |
|---|---|---|---|---|---|---|---|
| EFP | 16.60 | 16.66 | 16.82 | 16.39 | 0.15 | 2.15 | 0.3412 |
| LCF | -2.30 | -2.30 | -2.12 | -2.47 | 0.12 | 2.10 | 0.3508 |
| GDP | 24.37 | 24.36 | 24.66 | 23.97 | 0.23 | 2.11 | 0.3477 |
| POP | 15.47 | 15.43 | 15.67 | 15.28 | 0.13 | 1.75 | 0.4166 |
| FEC | 2.60 | 2.51 | 3.04 | 2.21 | 0.29 | 2.31 | 0.3150 |
| HEC | -0.47 | -0.48 | 0.30 | -1.66 | 0.51 | 0.85 | 0.6550 |
| REC | -0.38 | -0.37 | 0.30 | -1.56 | 0.50 | 1.26 | 0.5335 |
| ETI | 4.14 | 4.15 | 4.18 | 4.10 | 0.03 | 2.52 | 0.2832 |
As shown in Table 2, lnGDP has the highest value, followed by lnEFP, lnPOP, lnETI, and EC sub-types. Among these variables, lnHEC, lnREC, and lnFEC have the highest variation, whereas lnETI, lnLCF, and lnPOP have the lowest variation. Moreover, all variables have a normal distribution based on JB probability values.
Following that, the study examines correlations between the variables.
| EFP | LCF | GDP | POP | FEC | HEC | REC | ETI | |
|---|---|---|---|---|---|---|---|---|
| EFP | 1.00 | |||||||
| LCF | -0.84 | 1.00 | ||||||
| GDP | 0.88 | -0.83 | 1.00 | |||||
| POP | 0.90 | -0.62 | 0.84 | 1.00 | ||||
| FEC | 0.78 | -0.66 | 0.88 | 0.77 | 1.00 | |||
| HEC | -0.33 | 0.23 | -0.20 | -0.32 | -0.13 | 1.00 | ||
| REC | -0.20 | 0.19 | -0.16 | -0.18 | -0.12 | 0.96 | 1.00 | |
| ETI | 0.89 | -0.86 | 0.92 | 0.81 | 0.76 | -0.19 | -0.12 | 1.00 |
Notes: Values show correlation coefficients.
As shown in Table 3, lnEFP positively correlates with lnGDP, lnPOP, lnFEC, and lnETI, whereas it negatively correlates with lnHEC and lnREC. On the other hand, lnLCF has a negative correlation with lnGDP, lnPOP, lnFEC, and lnETI, whereas it has a positive correlation with lnHEC and lnREC. Because EFP proxies environmental degradation and LCF proxies environmental quality, it is natural to have these variables reverse signs in terms of their correlation with explanatory variables. Moreover, the study analyzes the nonlinearity of the variables.
| Variable | D2 | D3 | D4 | D5 | D6 | Result |
|---|---|---|---|---|---|---|
| EFP | 0.0000 | 0.0000 | 0.0000 | 0.0000 | 0.0000 | NL |
| LCF | 0.0000 | 0.0000 | 0.0000 | 0.0000 | 0.0000 | NL |
| GDP | 0.0000 | 0.0000 | 0.0000 | 0.0000 | 0.0000 | NL |
| POP | 0.0000 | 0.0000 | 0.0000 | 0.0000 | 0.0000 | NL |
| FEC | 0.0000 | 0.0000 | 0.0000 | 0.0000 | 0.0000 | NL |
| HEC | 0.0166 | 0.0617 | 0.3336 | 0.1421 | 0.0926 | M |
| REC | 0.0007 | 0.0019 | 0.1467 | 0.1453 | 0.0915 | M |
| ETI | 0.0000 | 0.0000 | 0.0000 | 0.0000 | 0.0000 | NL |
As shown in Table 4, most variables have a nonlinear structure. Among all, only lnHEC and lnREC have a mixed structure, where some dimensions of these variables are linear, while others are nonlinear. Hence, the variables considered are mainly nonlinear. Accordingly, as a nonlinear approach, the KRLS approach is used in a way consistent with the literature (Kartal et al., 2025).
Estimation Results by KRLS Approach
For empirical estimations, the study applies the KRLS approach. The results for AME using the main proxy of environmental sustainability (i.e., EFP) are reported in Table 5.
| Avg. | SE | t | P>t | P25 | P50 | P75 | |
|---|---|---|---|---|---|---|---|
| GDP | 0.09 | 0.02 | 3.87 | 0.0010 | 0.04 | 0.07 | 0.19 |
| POP | 0.17 | 0.04 | 4.20 | 0.0010 | -0.03 | 0.18 | 0.38 |
| FEC | 0.01 | 0.02 | 0.47 | 0.6430 | -0.03 | 0.01 | 0.04 |
| HEC | -0.03 | 0.01 | -4.51 | 0.0000 | -0.06 | -0.03 | 0.00 |
| REC | 0.01 | 0.01 | 1.72 | 0.1040 | -0.02 | 0.00 | 0.04 |
| ETI | 0.80 | 0.19 | 4.23 | 0.0010 | -0.02 | 0.68 | 1.40 |
| R2: 96.72 |
As shown in Table 5, lnETI, lnPOP, and lnGDP have a significant and increasing effect on lnEFP. Specifically, a 1% increase in lnETI, lnPOP, and lnGDP causes a 0.80%, 0.17%, and 0.09% increase in lnEFP. On the other hand, a 1% increase in lnHEC provides a 0.03% decrease in lnEFP. Also, both lnFEC and lnREC have an insignificant effect on lnEFP. Moreover, the factors' effects or the impact's power vary across percentiles of the factors. Furthermore, the estimation model has a high estimation capacity, around 96.72% of the variation in EFP. Hence, the empirical results reveal that only an increase in HEC benefits the decline of EFP in Lebanon.
Robustness Checks
As the last step, the study applies the KRLS approach by an alternative proxy of environmental sustainability (i.e., LCF), where the results are shown in Table 6.
| Avg. | SE | t | P>t | P25 | P50 | P75 | |
|---|---|---|---|---|---|---|---|
| GDP | -0.10 | 0.02 | -4.86 | 0.0000 | -0.19 | -0.11 | -0.01 |
| POP | 0.03 | 0.04 | 0.71 | 0.4860 | -0.06 | 0.05 | 0.11 |
| FEC | 0.00 | 0.02 | -0.11 | 0.9130 | -0.03 | 0.00 | 0.02 |
| HEC | 0.01 | 0.01 | 1.43 | 0.1720 | -0.01 | 0.01 | 0.03 |
| REC | 0.01 | 0.01 | 1.71 | 0.1050 | 0.00 | 0.01 | 0.05 |
| ETI | -0.81 | 0.17 | -4.66 | 0.0000 | -1.49 | -0.60 | -0.18 |
| R2: 82.64 |
As shown in Table 6, lnETI and lnGDP have a significant and decreasing effect on lnLCF. Specifically, a 1% increase in lnETI and lnGDP causes a 0.81% and 0.10% decrease in lnLCF. On the other hand, lnPOP, lnFEC, lnHEC, and lnREC have an insignificant effect on lnLCF. Moreover, the factors' effects or the impact's power vary across percentiles of the factors. Furthermore, the estimation model has a high estimation capacity, around 82.64% of the variation in LCF. Hence, the empirical results reveal that any factors considered support the increase of LCF in Lebanon.
Summary of the Empirical Results
Following the completion of the empirical analysis, Fig. 3 gives a graphical summary of the empirical results.
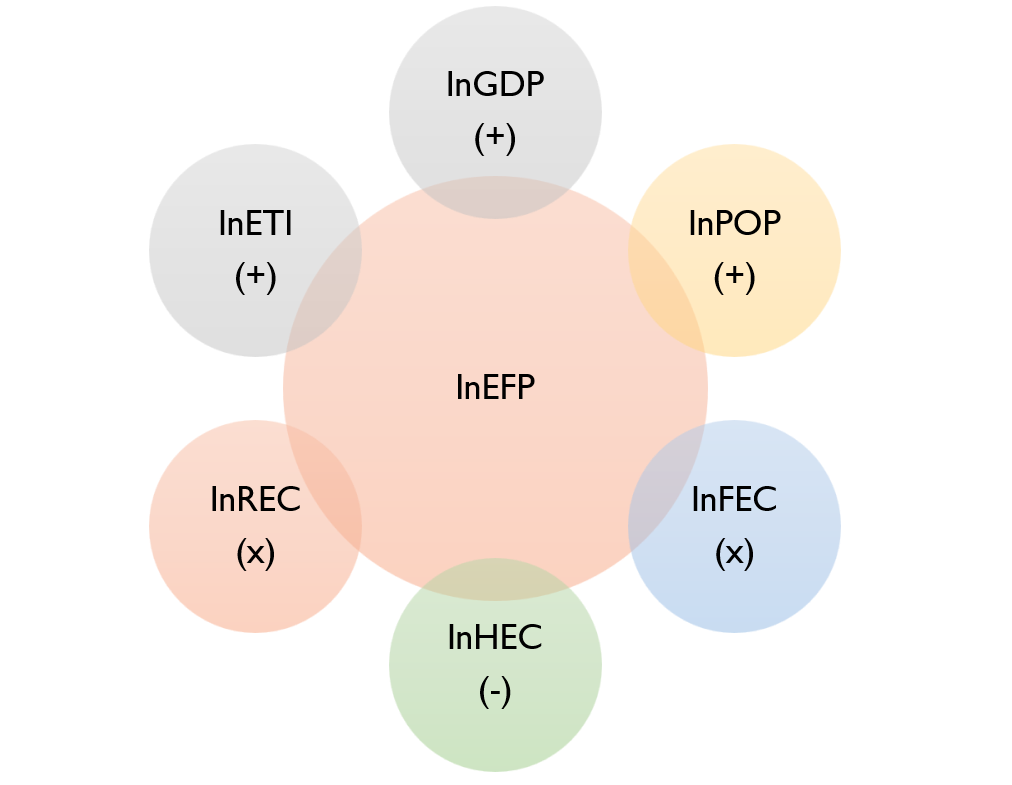
As demonstrated in Figure 4, increasing GDP, POP, and ETI does not help reduce EFP. Also, REC has an insignificant effect.On the other hand, only HEC has a good impact on decreasing EFP in Lebanon.
Conclusion
The world has been confronted with critical climate-related issues resulting mainly from environmental problems. Recently, there have been such adverse events as extreme weather cases, floods, high air temperatures, drought, and frost. Due to the adverse effects of such events on humanity, all countries have been concerned about how climate change can be slowed down by preserving the environment and ensuring environmental sustainability. Consistently, efforts of policymakers of countries and scientific scholars to determine the root causes of climate change and environmental degradation have been increasing day by day. In this context, various countries or country groups have been examined, different factors have been considered, and various econometric and statistical methods have been applied. In the case of the evaluation of the literature, it can be seen that although lots of countries have been examined by using various environmental proxies, considering different factors, and applying various methods, Lebanon, which is a key country in the MENA region, has been not examined by applying marginal effect analysis. Considering this literature gap, this study makes a marginal effect analysis on the sustainable environment of Lebanon by using a set of critical factors, such as GDP, POP, FEC, HEC, REC, and ETI, as consistent with the literature.
The results of the KRLS approach, which enables researchers to apply a marginal effect analysis, reveal some critical points. Among the variables considered, only HEC has a declining effect on EFP. Although HEC declines EFP, it does not contribute to the increase in LCF. Also, all other factors considered have either an increasing or insignificant effect on EFP. Moreover, the effects of the factors have a varying impact across percentiles of the variables. Furthermore, the KRLS results have a higher estimation capacity. Sixth, the empirical results are robust based on alternative indicator use.
Based on the empirical results obtained, a set of policy options can be discussed. First, Lebanese policymakers should give priority to HEC to decline EFP. In this context, supporting further generation and consumption of hydroelectricity is essential. So, Lebanese policymakers should continue to support hydroelectricity generation further by applying various fiscal and financial incentives, such as low-interest credits, land allocation, long-term purchasing guarantees, etc. In those ways, further, the generation of hydroelectricity and EFP can be decreased much more. On the other hand, it should not be forgotten that HEC is ineffective on LCF, which requires Lebanese policymakers to consider additional measures to ensure environmental sustainability.
Second, Lebanese policymakers should work on transforming the macroeconomic structure because the current growth model is not eco-friendly. In this context, supporting green technology and innovation import and R&D investments in the energy area is an option for Lebanon. With the application of such policies and other policies that can be suitable for Lebanon, it can be possible to turn the economic growth model into an eco-friendly one, where increasing income may help decline environmental degradation.
Third, Lebanese policymakers should deal with the population because the current population increase has been causing environmental degradation as well. Therefore, Lebanese policymakers must create public awareness campaigns to direct the community into eco-friendly consumption habits.
Fourth, Lebanese policymakers should deal with about clean energy use much more. Because REC and ETI are ineffective in contributing to the decline in EFP, it shows that current clean energy policies and paths are unsuitable for Lebanon. Accordingly, taking immediate corrective actions in these areas is inevitable so Lebanon can benefit from clean energy to ensure environmental sustainability.
Although this study tries to make a detailed analysis, it has some limitations. Accordingly, new studies can include many more countries from the MENA region, consider other explanatory variables not included in this study, and perform other novel econometric analyses to uncover hidden sides of environmental sustainability.
Funding Statement
This research did not receive any specific grant from funding agencies in the public, commercial, or not-for-profit sectors.
Conflict of Interest
The authors declare that they have no competing interests.
Nomenclature
| Acronyms | |
|---|---|
| AME | Average Marginal Effect |
| ARDL | Augmented Autoregressive Distributed Lag |
| BDS | Broock, Scheinkman, Dechert, and LeBaron |
| DOLS | Dynamic Ordinary Least Squares |
| EC | Electricity Consumption |
| EKC | Environmental Kuznets Curve |
| FMOLS | Fully Modified Ordinary Least Squares |
| GFN | Global Footprint Network |
| KRLS | Kernel-Based Least Squares |
| MENA | Middle East North Africa |
| UNCTAD | United Nations Conference on Trade and Development |
| WB | WorldBank |
| Dependent Variable | |
| EFP | Ecological Footprint |
| LCF | Load Capacity Factor |
| Independent Variables | |
| GDP | Gross Domestic Product |
| POP | Population |
| FEC | Fossil EC |
| HEC | Hydro EC |
| REC | Renewable EC |
| ETI | Energy Transition Index |
| Alternative Dependent Variable for the Robustness | |
| LCF | Load Capacity Factor |
References

About contributors

Fatih Ayhan
Department of Economics, Bandırma Onyedi Eylül University, Balıkesir, Türkiye
Türkiye