Abstract
The ongoing inquiry revolves around whether natural resources heightened geopolitical risk and economic policy uncertainty will act as mitigating or amplifying factors about pollution. In delving into this matter, this study investigates whether natural resources, geopolitical risk, and economic policy uncertainty act as mitigating or amplifying factors on environmental quality in India, given the country's rapid economic expansion and increasing energy demands. Employing quarterly data from 2003/Q2 to 2022/Q4 in India, the study empirically examines how geopolitical risk and economic policy uncertainty effectively influence ecological quality measured by the load capacity factor while considering the roles of natural resources and energy consumption. The analysis employs recently developed econometric methods, Quantile-on-Quantile Granger Causality and Quantile-based Augmented Dickey-Fuller, marking their novel application in the context of India's environmental sustainability literature to unveil causal connections among variables. The results indicate that natural resources, economic growth, renewable energy, economic policy uncertainty, and geopolitical risk collectively demonstrate forecasting capabilities over Ecological Quality. This study's originality lies in employing advanced quantile-based techniques, providing insights into asymmetric and nonlinear relationships in the data. Therefore, it is necessary for targeted environmental policies to ensure sustainable ecological management in India's ongoing economic growth trajectory.
Introduction
The worldwide mandate for ecological sustainability has become a central concern in policy development among leading nations. Originating from the 1997 Earth Summit in Kyoto and gaining momentum through the 2015 Paris Agreement on climate change, this commitment is reinforced at the recent COP26 conference in Glasgow. The conference emphasized the pressing need for nations to reduce CO$_2$emissions and enact strategic measures to improve ecological conditions. These collective endeavors signify a dedicated trajectory toward protecting our planet from ecological crises and mitigating climate change, considering the substantial health risks faced by approximately 80% of the global population due to ecological deprivation (Ibrahim et al., 2022).
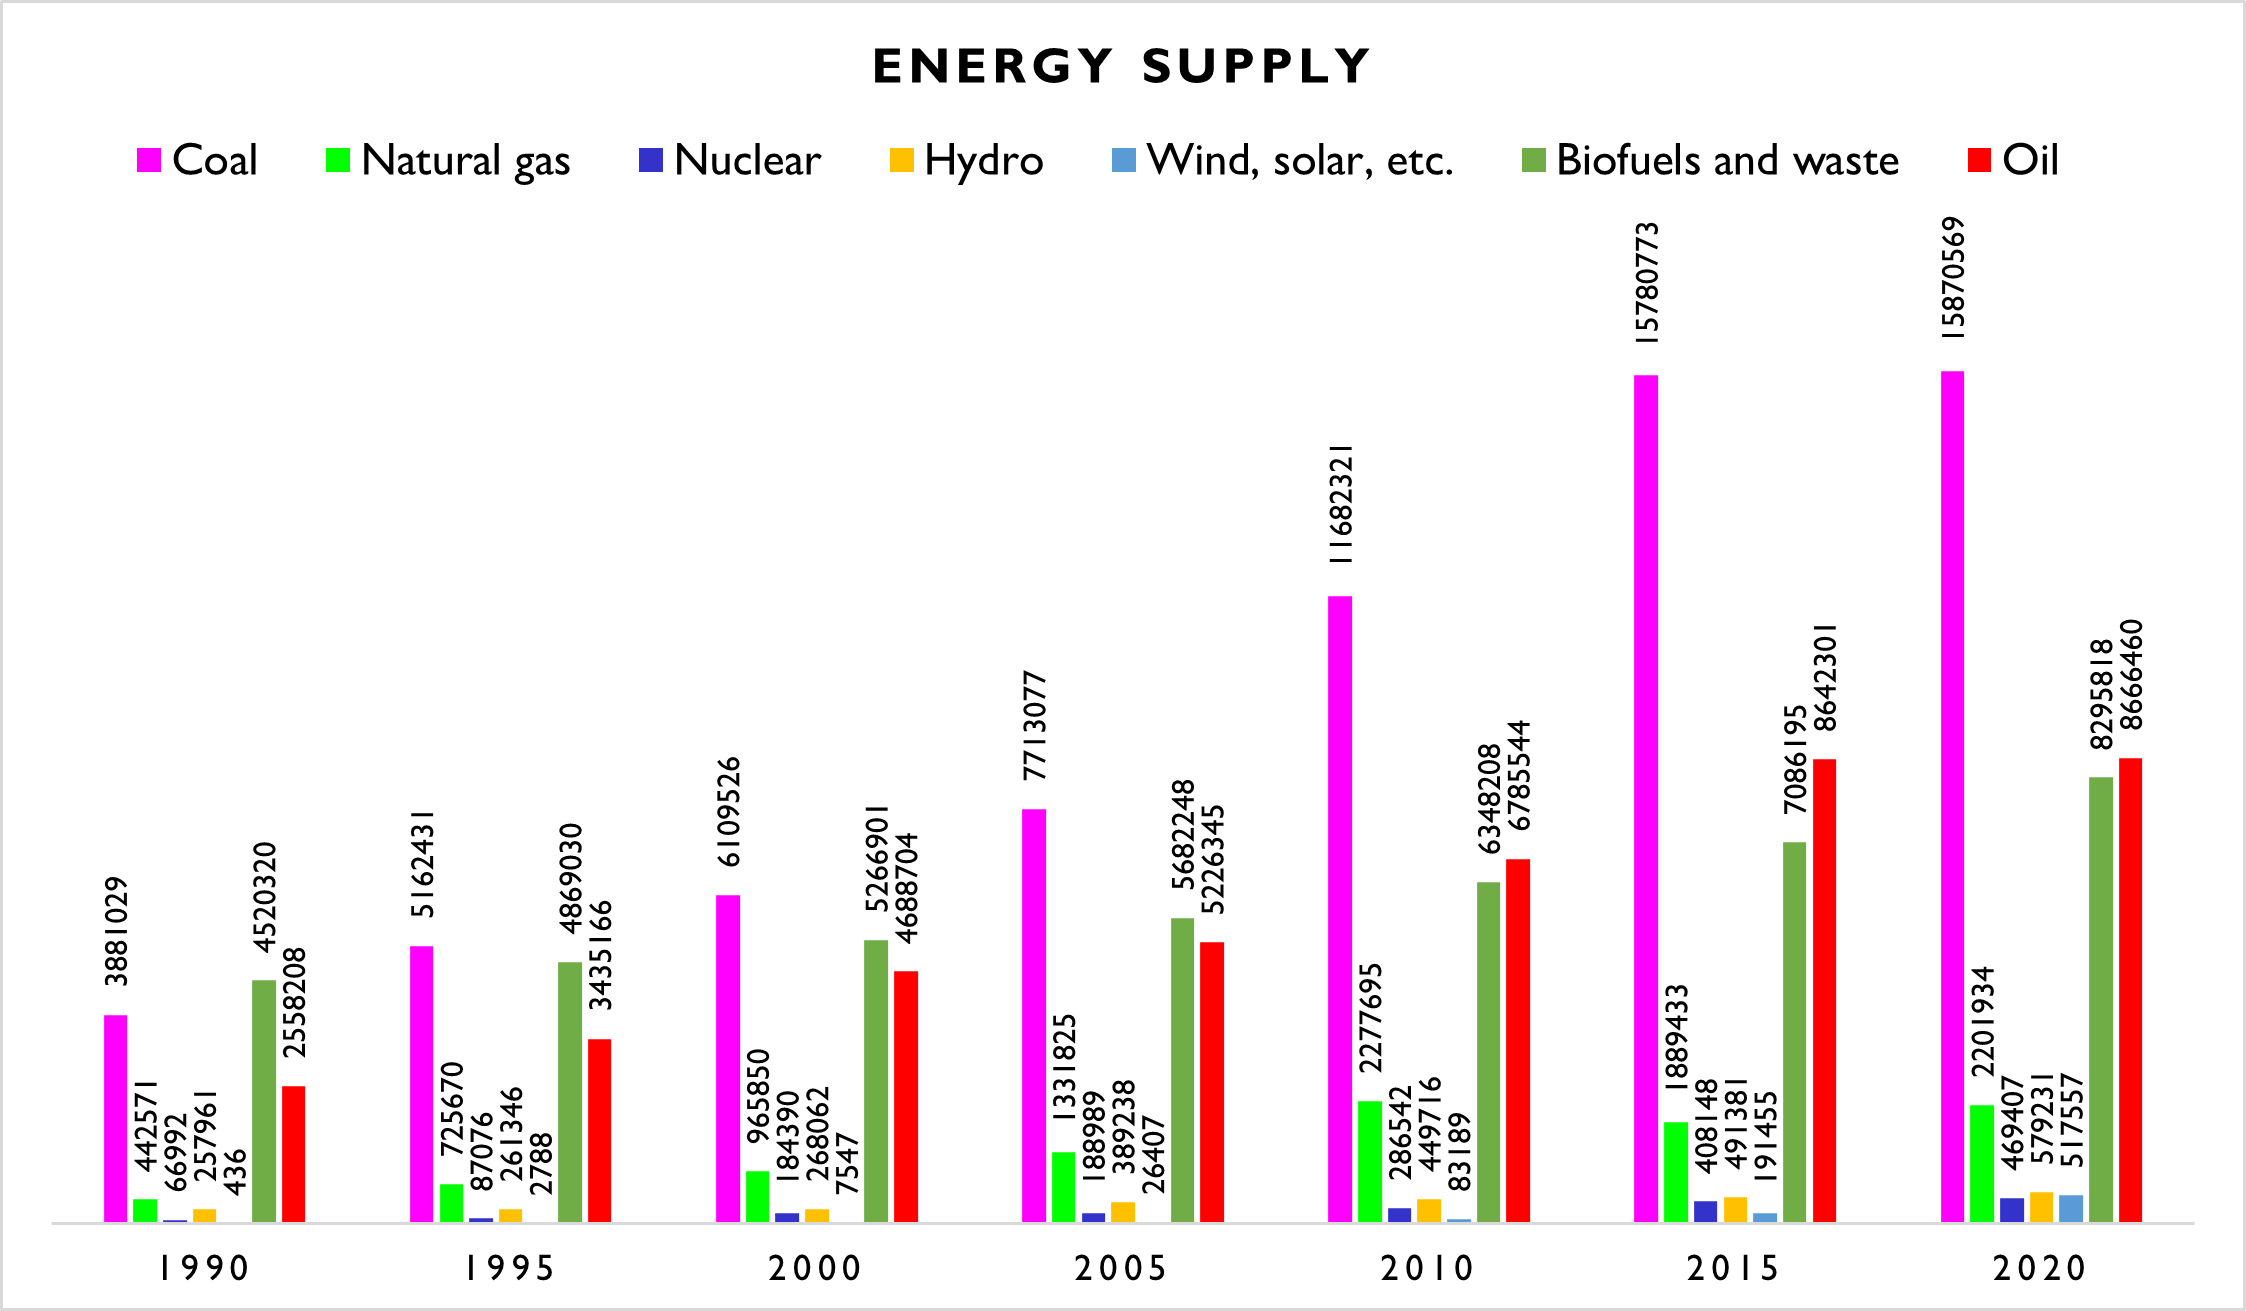
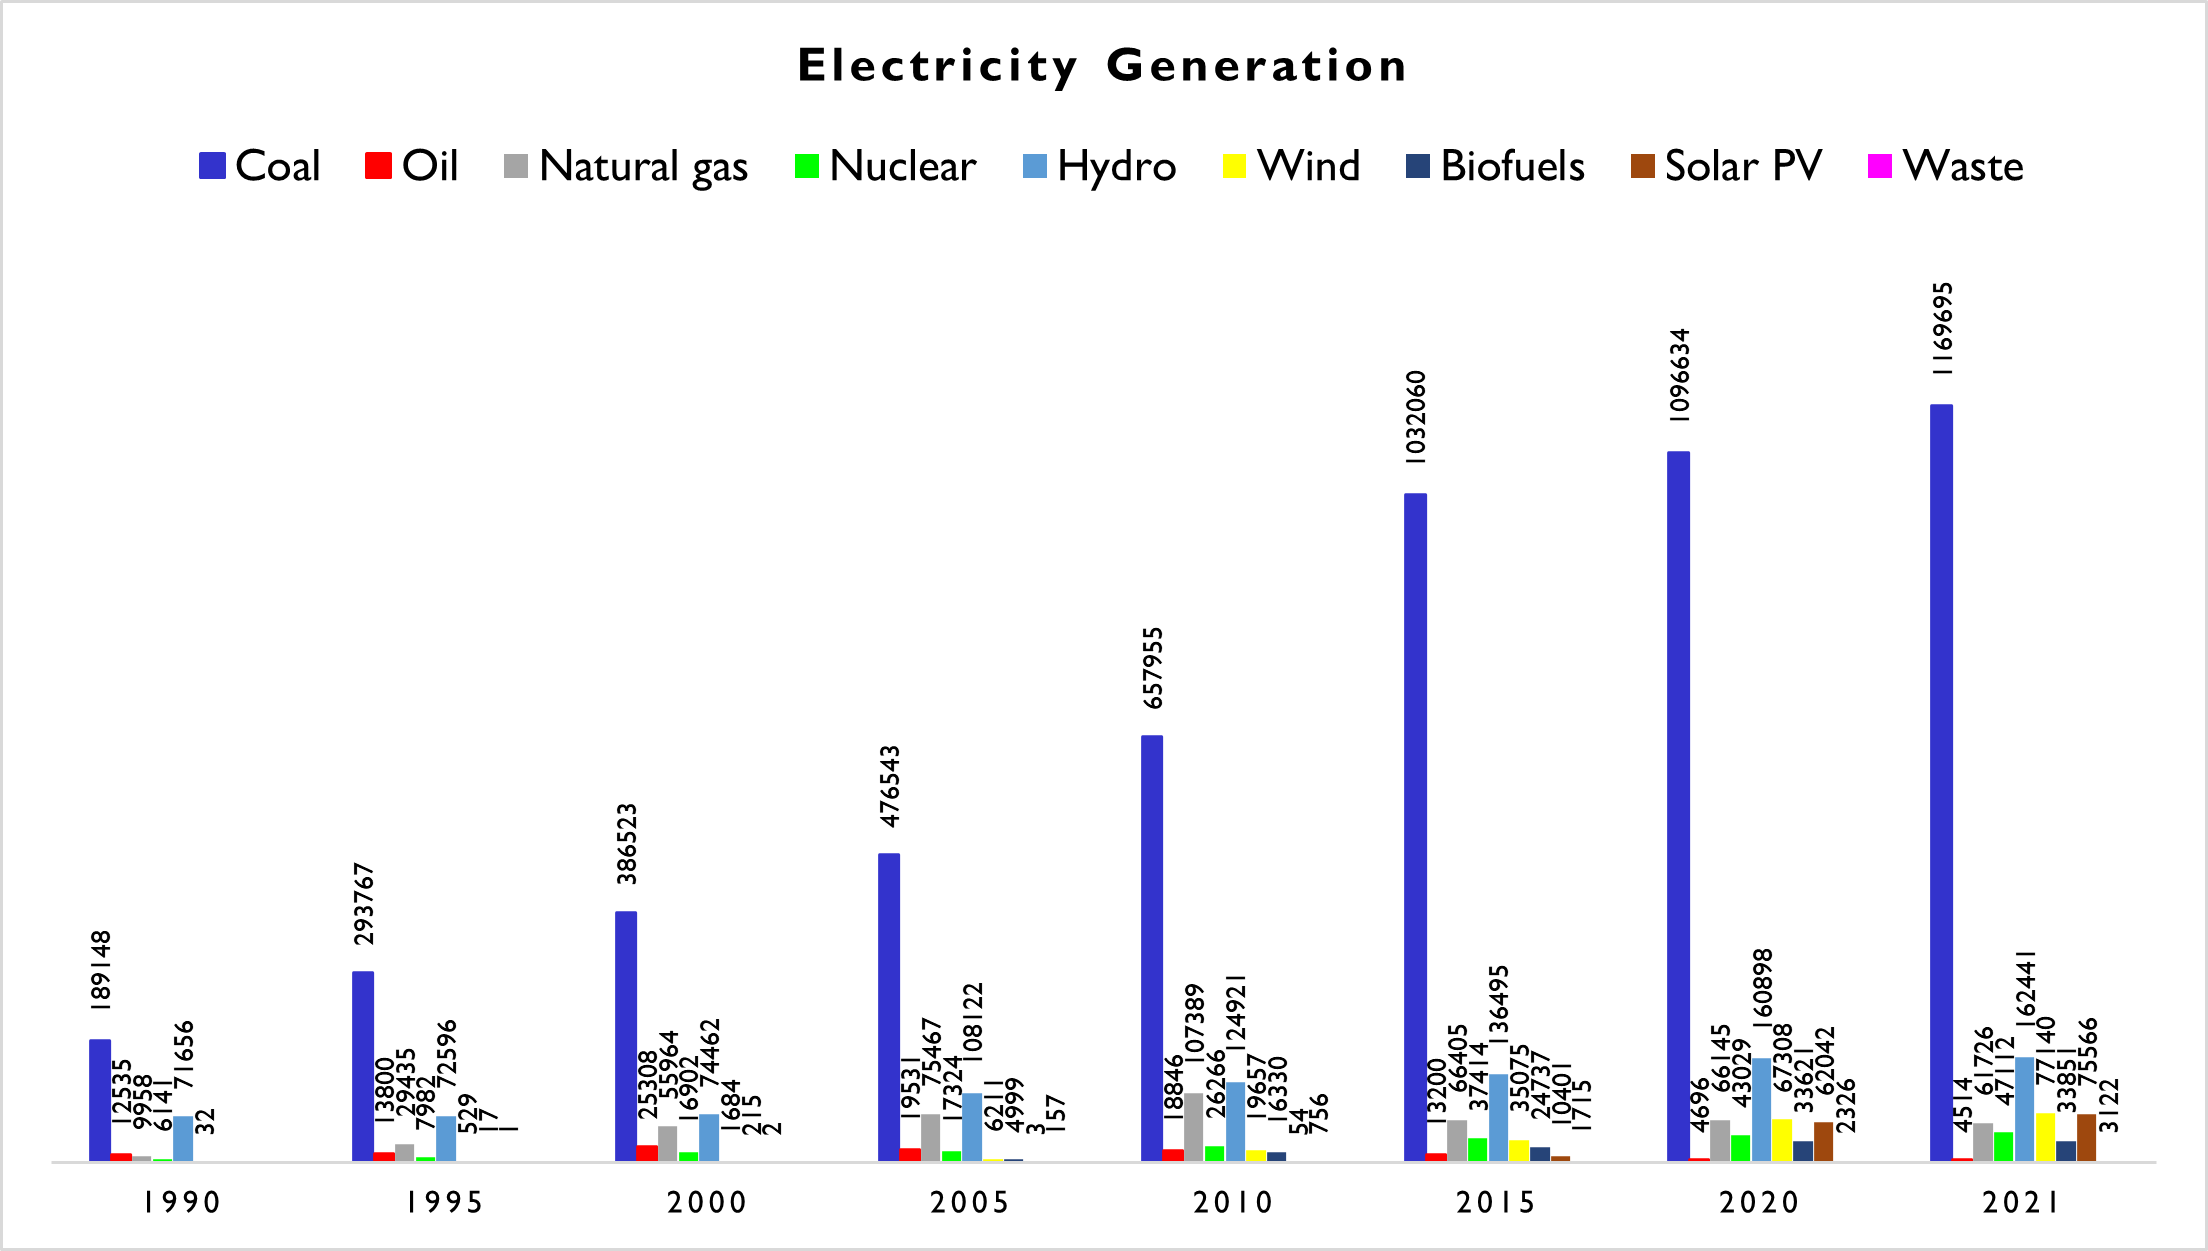
The remarkable economic prosperity and growth, predominantly in developing economies in recent years, have imposed escalating weight on ecosystems, resulting in environmental imbalances, loss of biodiversity, and a surge in CO$_2$(Acheampong et al., 2022). Undoubtedly, formulating policy frameworks to solve ecological challenges and achieve sustainable environmental purposes is paramount, with specific emphasis on India (BP, 2024). The nation’s burgeoning population and rapid economic expansion have led to a significant increase in emissions in recent decades (BP, 2024). In 2021, India emerged as the world’s third-largest emitter of GHGs, following China and the U.S., with emissions reaching 3.9 billion metric tons of CO$_2$equivalent (GtCO$_2$e), constituting approximately seven percent of the global total (BP, 2024). Notably, India’s per capita GHGs emissions are well below the global average at 2.8 tCO$_2$e, in contrast to 9.6 tCO$_2$e in China and 17.6 tCO$_2$e in the United States. Furthermore, India’s historical cumulative CO$_2$emissions contribute to less than 4% of other major nations (BP, 2024). Likewise, as shown in Figure 1, coal and oil consumption constitute a significant proportion of India's total energy supply. Again, electricity generation in India by sources has a high proportion of coal and oils (Figure 2), thus validating that the energy used in promoting economic growth is predominantly from fossil fuel-based energy.
Recent scholarly discussions have delved into critical drivers of a sustainable ecosystem, prominently including economic growth (Abbasi et al., 2021) and energy usage (Akram et al., 2020; Irfan et al., 2022; Shang et al., 2022; Irfan et al., 2023; ). These investigations underscore the vital need for policymakers and environmental advocates to take into account the significance of these factors in safeguarding the ecosystem and charting a course toward sustainability. Within the realm of environmental concerns, economic growth has emerged as a central indicator with notable implications for environmental quality (Ullah et al., 2023). The escalating levels of economic activity contribute to increased prosperity but concurrently result in an upsurge in emissions. Sectors such as manufacturing, agriculture, mining, and transportation to economic progress often come at the expense of ecological squalor (Singh et al., 2023). For instance, manufacturing processes involving heavy machinery reliant on fossil fuels significantly worsen ecological deterioration. Similarly, transporting goods for final consumption amplifies emissions. Undoubtedly, researches by Ozturk and Acaravci (2016) and Akram et al. (2020) consistently indicate that pivotal economic activities that foster growth exert adverse effects on the ecosystem.
Prior research consistently affirms that energy usage is a primary indicator of sustainable development. Undoubtedly, the global energy demand has experienced a notable surge. Investigations conducted by Acheampong et al. (2019) and Irfan et al. (2023) underscore that prevailing global concerns revolve around CO$_2$and energy demand. As Alola et al. (2023) articulated, a substantial 70% increase in global electricity demand is attributed to significant nations, including India. These studies shed light on severe challenges within the energy economics framework, encompassing uncertainties in energy supplies, dependence on fossil-based energy sources, and inadequacies in clean energy infrastructure. Intricately linked to ecological well-being, these challenges underline the intricate interplay between ecological welfare and energy dynamics.
An emerging trend in the literature increasingly advocates for including non-environmental determinants in formulating policies addressing emission mitigation and sustainable environmental practices. Numerous studies have underscored the challenges of long-term climate change policy formulation due to inherent uncertainties. For instance, Hassan et al. (2022) delve into the effect of EPU on ecological considerations alongside significant macroeconomic variables. The findings highlight that EPU has become a pivotal factor in the discourse surrounding environmental and economic policy debates. EPU introduces ambiguity into fiscal and monetary policy decision-making processes, thereby influencing the choice-making behavior of businesses. The study by Amin and Dogan (2021) emphasize that the vagueness associated with economic policies significantly impacts ecological outcomes. It is evident that EPU prioritizes governmental strategies related to ecological concerns, subsequently affecting ecological well-being (Jiao et al., 2022; Li et al., 2022).
An additional dimension in the literature has investigated the intricate interrelationship between GPR and environmental factors (Hashmi et al., 2022; Feng et al., 2023). GPR involves uncertainties and tensions arising from wars, external violence, strained political relations between states, and terrorism. An expanding body of investigations suggests that geopolitical tensions can exert an impact on economic activities and investments, subsequently influencing business operations and resource utilization, particularly in the context of natural resources and fossil fuels (Anser et al., 2021). Moreover, Hashmi et al. (2022) propose two significant conduits through which GPR influences environmental well-being: the “escalating effect" and the "mitigating effect.” Underneath the intensifying effect, GPR reduces the utilization of RE sources, resulting in an increased reliance on fossil-based energy, consequently elevating CO$_2$. Conversely, the mitigating effect posits that GPR leads to lessening the RE resources, thereby contributing to decreased emissions. In a study specific to India, Zhao et al. (2021) reports a "mitigating impact” of GPR on emissions. Nevertheless, the existing literature presents inconclusive discoveries on GPR's effect on CO$_2$.
The main aim of the study is to provide insights on policy frameworks for achieving sustainable development after setting challenging targets for reducing greenhouse gas emissions, promoting renewable energy, and achieving net-zero goals in the recent climate change conference, COP26, and the Paris Agreement. Also, these international commitments define both a global roadmap and serve as a framework within which national policies are created. Since India signed both agreements, its domestic strategies designed in the NAPCC, state-level climate action plans, and recent commitments to achieve net-zero emissions by 2070, are directly influenced. By aligning its environmental objectives with global benchmarks, India underscores the importance of sustainable development while addressing its unique socio-economic challenges. More specifically, this study aims to empirically examine the influence of economic growth, economic policy uncertainty, energy consumption, and geopolitical risk on environmental quality, using the load capacity factor as a holistic measure, which is also aligned with the studies of Zhao et al. (2021) and Tauseef Hassan et al. (2023). To reach this aim, the data used in the analysis is selected to cover the period from 2003/Q2 to 2022/Q4 and is designed to include two specific empirical model-building exercises. By incorporating novel factors such as economic policy uncertainty and geopolitical risk into the framework, the study aims to derive crucial insights for shaping environmental sustainability policies in India. This unique aim is to contribute to the existing literature by addressing the synchronized impacts of EPU and GPR on ecological quality (represented by LF) while accounting for the roles played by natural resources and renewable energy. This study tackles a significant research question specific to India, and, to the best of our knowledge, no prior empirical investigations have ventured into this territory.
The findings of this study are expected to make substantial contributions to the literature, shedding light on the nuanced dynamics of environmental sustainability policies in the context of India. First of all, the investigation seeks to solve the existing literature gap by inspecting key influencers' impacts on ecological quality, specifically within the context of EPU, GPR, and NATR.
Secondly, the study considers the LF as a thorough environmental quality assessment. Specifically, ecological footprint primarily addresses the demand side of environmental resources, measuring human consumption of natural capital. Also, CO$_2$emissions focus on greenhouse gases, giving limited insight into broader ecological impacts Wu et al. (2021) and Ali et al. (2023). On the other hand, the LF stands out as a more comprehensive metric that integrates both the demand and supply aspects of environmental assets compared to single-faceted metrics like CO$_2$emissions or the EF. Also, the LF effectively represents regional carrying capacity by clearly indicating sustainability thresholds, where values above 1 suggest ecological balance and values below 1 signal unsustainable environmental conditions (Awosusi et al., 2022). In comparison to indicators like EF and CO$_2$, LF proves to be more precise in offering a holistic evaluation of ecological dynamics. This inclusivity permits a more detailed and nuanced ecological analysis, providing a detailed standpoint on the interaction between ecological demand and supply.
Thirdly, the QADF suggested by Adebayo and Özkan (2024) to identify the stationarity features of variables is applied. Unlike the conventional ADF, the QADF test enables the detection of structural changes at various levels of the distribution. This adaptability is valuable when analyzing time series data with diverse features across different quantiles. Moreover, it employs the QQGC initiated by Adebayo and Özkan (2024) to investigate the predictive power of the regressors over LF. The QQGC demonstrates resilience to extreme values and outliers. Concentrating on quantiles mitigates the impact of exceptional observations, rendering it suitable for datasets exhibiting skewed or non-normal distributions.
Lastly, and most importantly from a practical standpoint, recommendations for sustainability policies in the context of India are put forth. It is crucial to discern how India, in chase of growth objectives and amid increasing energy demands, endeavors to uphold ecological excellence. Given the substantial predictive influence of the regressors on the dependent variables, policymakers are advised to formulate policies that concurrently safeguard the environment and economy. This signifies an essential policy-oriented extension of the present investigation.
The following sections present the concluding segments of the study. Sections 2 and 3 provide a synopsis of previous studies, as well as details on methods. Sections 4 and 5 offer a discussion of the study's findings and its concluding remarks, followed by the presentation of policy recommendations.
Literature Review
The escalation of CO$_2$ emissions is the primary driver behind climate change and global warming, resulting in profound impacts on the environment. The heightened levels of CO$_2$ and other greenhouse gases contribute to the enhanced greenhouse effect, causing an elevation in global temperatures. This temperature rise disrupts weather patterns, leading to more severe and frequent heatwaves. Additionally, climate change worsens extreme weather events, including hurricanes, droughts, wildfires, and floods, imparting extensive ecological, economic, and social consequences. Efforts to mitigate the adverse effects necessitate addressing the root causes of climate change, reducing CO$_2$, and implementing complete climate mitigation and adaptation strategies. While abundant studies in the energy and ecological literature have inspected these issues, inconclusive results have emerged, underscoring the need for further investigations.
Impact of GDP and RE on Ecological Quality/Degradation
Regarding the effect of RE and GDP on ecological degradation, scholars have demonstrated the significant role played by these variables. For illustration, from the global economy perspective, Kirikkaleli and Adebayo (2021)investigation on the drivers of CO$_2$ using the FMOLS reported the effectiveness of RE in curbing ecological deterioration while GDP intensifies CO$_2$by increasing ecological deterioration. A similar perspective is supported by the investigation of Irfan et al. (2022). In their investigation using the wavelet tools, where the findings based on quarterly data from 1990 to 2021, show that an increase in RE usage is paramount to cutting GHGs while the growth of GDP is not sustainable for the case of the UK. Likewise, Awosusi et al. (2022) in their analysis of the drivers of GHGs used data from 1990 to 2020 specifically RE and GDP to draft green polices of top energy transition nations. Their investigation outcomes showed that GDP inhibits ecological integrity while RE boosts ecological deterioration using the CS-ARDL estimator. The investigation of Çitil et al. (2023) employed the MMQR in their analysis in examining the drivers of CO$_2$ with a primary focus on RE and GDP, with the discoveries showing that RE improves ecological quality while GDP intensifies CO$_2$. Similarly, using the wavelet tools for the German case, Yan et al. (2024), by focusing on the periods specifically, short, medium, and long, disclosed that growth in RE in the short and medium-term lessens GHGs while in the long-term RE does not significantly lessen GHGs. Moreover, across all the periods, GDP growth is found to harm the ecosystem. Furthermore, the analysis of Adebayo and Özkan (2024) using the WQR from 1990 to 2020 explored the role of RE and GDP towards ecological deterioration by considering all quantiles and periods, with the results emerging suggesting that RE and GDP lessen and increase CO$_2$respectively. Moreover, using the Vietnam case in their analysis, the investigation of Awosusi et al. (2023) utilizing the ARDL from 1990 to 2020 disclosed that GDP curbs ecological excellence while RE intensifies environmental integrity.
Impact of EPU and GPR on Ecological Quality/Degradation
An upsurge in EPU can potentially result in a reduction in economic and investment activities. Uncertainty in policy environments may induce businesses to postpone capital investments, subsequently influencing the adoption of eco-friendly practices and technologies. The contraction in economic activity could contribute to diminished greenhouse gas emissions stemming from reduced energy consumption and industrial production. Geopolitical risks can disrupt global supply chains, affecting the production and transportation of goods. Disruptions may lead to changes in production locations, energy usage patterns, and transportation modes, all of which can influence GHG emissions. In a study covering the BRICS nations from 1990 to 2018, (Li et al., 2023) investigates the drivers of CO$_2$, focusing on the roles played by EPU and GPR. Employing tests such as Westerlund cointegration and CSARDL, the study revealed that both EPU and GPR restrain ecological quality by intensifying CO$_2$. Furthermore, Jiao et al. (2022) utilizes the TVP-VAR model for the Chinese case, disclosing that, in both the short and long term, EPU diminishes ecological excellence by limiting CO$_2$, while GPR exacerbates ecological deterioration. Lastly, the investigation by Balsalobre-Lorente et al. (2024) for the G20 economies, using FMOLS from 1997 to 2018, finds that EPU hampers ecological excellence by limiting CO$_2$, while GPR intensifies ecological deterioration.
Impact of NATR on Ecological Quality/Degradation
The processing and extraction of NATR have the potential to create contamination. For example, mining operations may discharge heavy toxins and metals into water bodies, causing harm to aquatic ecosystems. Likewise, the combustion of fossil fuels, considered a NATR, can result in air contamination that impacts both aquatic and terrestrial environments. NATR plays a critical role in supporting human well-being by supplying energy, food, and raw materials. Sustainable management of these resources entails striking a balance between fulfilling human needs and safeguarding ecological integrity, ensuring the sustained health of ecosystems over the long term. Examining data spanning from 1990 to 2018, Jahanger et al. (2023) conducted a study delving into the factors influencing CO$_2$ levels, with a particular emphasis on NATR within the context of 73 developing nations. The investigation reveals that the rise in CO$_2$is directly linked to the increase in NATR. Similarly, Itoo and Ali (2022) employs wavelet coherence to analyze the drivers of CO$_2$ from 1980 to 2018. Their findings indicate that a decrease in CO$_2$is associated with an escalation in NATR, thereby posing a threat to environmental quality. Furthermore, focusing on MMQR and E7 nations, Chen et al. (2023) scrutinize the drivers of CO$_2$, with a specific emphasis on NATR. The outcomes disclosed that the expansion of CO$_2$is attributed to the intensification of NATR, ultimately posing a constraint on ecological excellence. In a parallel investigation, Aga et al. (2023) explore the drivers of CO$_2$, utilizing data from 1990 to 2019 and concentrating on the BRICS nations. The study indicates that the surge in CO$_2$ is credited to the corresponding upswing in NATR.
Summary of Literature and Gaps Identification
The prevailing studies have recognized the growing significance of GPR on CO$_2$(Anser et al., 2021; Balsalobre-Lorente et al., 2024). Another aspect discussed in prior investigation highlights the role of EPU on CO$_2$(Jiao et al., 2022; Li et al., 2023). However, the ongoing discourse has treated the connections between the GPR and EPU as distinct topics. Furthermore, limited investigations have delved into the interconnected framework of energy–economic –risk–uncertainty–environment for achieving sustainability. To comprehensively understand the levels of ecological impairment and establish connections with its primary drivers, it is essential to undertake a holistic model-building exercise rather than addressing each aspect separately. A thorough examination of an integrated outline is anticipated to yield fresh intuitions that can guide policy implications toward sustainable development. This research endeavors to fill the initial gap in the existing literature by addressing this need for an integrated approach. Prior studies have predominantly employed either the EPU or GPR as proxies for uncertainty. However, a single indicator cannot fully capture the multifaceted nature of political and economic uncertainties, encompassing both local and global dimensions. This research addresses the second significant gap by incorporating two distinct measures of uncertainty, namely EPU and GPR, into the empirical model-building exercises. The EPU index reflects global economic and monetary uncertainty, potentially influencing a country's business decisions and consequently impacting ecological integrity. Conversely, the GPR index focuses on uncertainty arising from geopolitical actions such as political unpredictability, terrorism, and wars. Furthermore, from an empirical research perspective, prior studies have extensively utilized CO$_2$as a proxy for evaluating ecological excellence (Shang et al., 2022). Nevertheless, a substantial segment of the literature posits that it is crucial to scrutinize environmental conditions by utilizing proxies that account for the ecosystem's supply and demand aspects. Additionally, previous studies have used various causality tests to explore these connections. However, none of these studies have considered both the quantiles of the dependent and independent variables simultaneously. This study seeks to solve these four significant research gaps by examining the impact of key drivers on environmental sustainability. Furthermore, the QQGC method is applied to establish causal associations across all quantiles of both dependent and independent variables.
Methods
Research Data
The objective of this inquiry is to investigate the impact of geopolitical risk and economic policy uncertainty on the load capacity factor while also considering the contributions of natural resources, renewable energy, and economic growth within the context of India. The study employs the quadratic match sum-up method suggested by prior studies to address the challenge of limited data (Shahbaz et al., 2020; Adebayo & Özkan, 2024). Consequently, the data are transformed from yearly to quarterly intervals. The dependent variable in the analysis is LF, while the other variables, including GPR, NATR, RE, and GDP, serve as regressors. Moreover, LF encompasses both the demand and supply of ecological properties, making it a more precise indicator than EF and CO$_2$. Thus, it provides a comprehensive ecological analysis. The empirical section of this study utilizes annual time quarterly data for India covering 2003 to 2022. The selection of this timeframe is based on India's post-reform period, during which the country transitioned from state-led growth to market-driven growth as part of economic reforms, leading to remarkable economic growth. Table 1 provides information on the origins of the utilized data, offering details on the sources from which the data are collected and their respective measurement methods.
| p0.12p0.18p0.18p0.32p0.12 | ||||
|---|---|---|---|---|
| Symbol | Variables | Gauge | References | Source |
| LF | Load Capacity Factor | Biocapacity/ Ecological Footprint | Shang et al. (2022) and Kartal (2024) and Özcan et al. (2024) | (GFN, 2023) |
| GPR | Geopolitical Risk | Index | Anser et al. (2021) and Das et al. (2019) and Sharif et al. (2020) and Kartal (2023) | (PU, 2023) |
| EPU | Economic Policy Uncertainty | Index | Hassan et al. (2022) and Adedoyin et al. (2020) | (PU, 2023) |
| NATR | Natural Resources | % of GDP | Aga et al. (2023) and Amin et al. (2023) and Badeeb et al. (2020) | World Bank (2024) |
| RE | Renewable Energy | Per Capita | Abbas et al. (2022) and Akram et al. (2020) and Adedoyin et al. (2021) and Kartal (2023) | (OWD, 2023) |
| GDP | Economic Growth | GDP Per capita US$2015 constant | Acheampong (2018) and Agyekum et al. (2022) and Kılıç Depren et al. (2023) | (World Bank, 2024) |
Research Method
The study employs a series of quantile-based approaches based on the nonlinear attributes of the series. Firstly, the QADF test is used following the studies of (Adebayo & Özkan, 2024). The QADF advantage over the conventional ADF is as follows:
- The QADF test exhibits resilience in the face of non-normality or outliers in the data, rendering it suitable for the analysis of time series data that does not strictly affirm normality.
- By examining quantiles, the QADF test enables the detection of structural changes at various distribution levels. This adaptability is valuable when analyzing time series data with diverse features across multiple quantiles.
- In specific scenarios, the QADF test may demonstrate enhanced statistical power compared to the conventional ADF test, particularly in the presence of heteroscedasticity or outliers within the data.
- When contrasted with traditional tests, the QADF test showcases robustness to non-linear patterns in the data, facilitating a more comprehensive analysis of time series data that may display non-linear features.
Secondly, it is applied the newly introduced the QQGC. The conventional GC introduced by Granger (1969), indicating the influence of X on Y, is formally expressed in Equation (1) as follows:
$\tag{eq:eq1} Y_t = \gamma_0 + \sum_{i=1}^{p} \gamma_i Y_{t-i} + \sum_{i=1}^{p} \beta_i X_{t-i} + \varepsilon_t$
Here, $\gamma_0$ represents the constant term, $p$ denotes the lag order, and time is illustrated by $t$. The coefficient of the lagged values of $Y$ is shown by $\gamma_i$, the lagged values of $Y$ at various periods $(t-1,t-2,\ldots,t-p)$ is shown by $Y_{t-i}$, the lagged values of $X$ at different time periods $(t-1,t-2,\ldots,t-p)$ are signified by $X_{t-i}$, and $t$ and $\varepsilon_t$ illustrates time and error term.
To extend the application of the GC method to the conditional distribution, several QGC approaches have been proposed in the literature, as evidenced by studies such as those Balcilar et al. (2016) and Troster (2018). Nonetheless, these techniques primarily focus on the conditional distribution of the dependent indicator. To address this limitation, it is utilized the QQGC technique introduced by Adebayo and Özkan (2024). Unlike existing techniques, QQGC reflects the conditional distribution of both the X and Y variables. Precisely, QQGC explores causality by examining the interrelationship between quantiles of Y and X. This nuanced technique enables a more all-inclusive causality analysis likened to traditional QGC and GC methods.
Given this information, it can be expressed the QQGC in Equation (2) in the following way:
$\tag{eq:eq2} QY_{\tau,t} = \gamma_{\tau,0} + \sum_{i=1}^{p} \gamma_i QY_{\tau,t-i} + \sum_{i=1}^{p} \beta_i QX_{\theta,t-i} + \varepsilon_{\tau,\theta,t}$
where $0 < \tau$ and $\theta < 1$. The constant term at quantile $\theta$ and $\tau$ are shown by $\gamma_{\tau,\theta,0}$. $\gamma_i$ represents lagged value of the coefficient value of the $\tau$-th conditional quantile of $Y$, the lagged values of $\tau$-th conditional quantile of $Y$ at various periods $(t-1,t-2,\ldots,t-p)$ is illustrated by $Y_{t-i}$. $\beta_i$ shows the coefficients of $\theta$-th conditional quantile of $X$ lagged value, lagged values of the $\theta$-th conditional quantile of $X$ at various periods $(t-1,t-2,\ldots,t-p)$ is symbolized by $X_{t-i}$ and error term at the time $t$, quantile $\tau$ and $\theta$ are shown by $\varepsilon_{\tau,\theta,t}$.
To execute QQGC, it is followed the study of by considering quantiles ranging from 0.05 to 0.95 at intervals of 0.05 for both the dependent and independent variables following Li et al. (2015) investigation. The QQGC technique integrates all the benefits of the following quantile-based approaches:
- QQGC facilitates a more intricate causality analysis by scrutinizing the relationships between the quantiles of the independent variable and those of the dependent variable. This approach enhances our comprehension of how causality might vary across distinct quantile levels.
- The QQGC demonstrates resilience to extreme values and outliers. Concentrating on quantiles mitigates the impact of exceptional observations, rendering it suitable for datasets exhibiting skewed or non-normal distributions.
- QQGC operates without dependence on specific assumptions regarding the underlying data distribution. This distinguishing enlarges its applicability to diverse data types, encompassing those that deviate from a normal distribution Koenker and Hallock (2001) and Martins-Filho and Yao (2008).
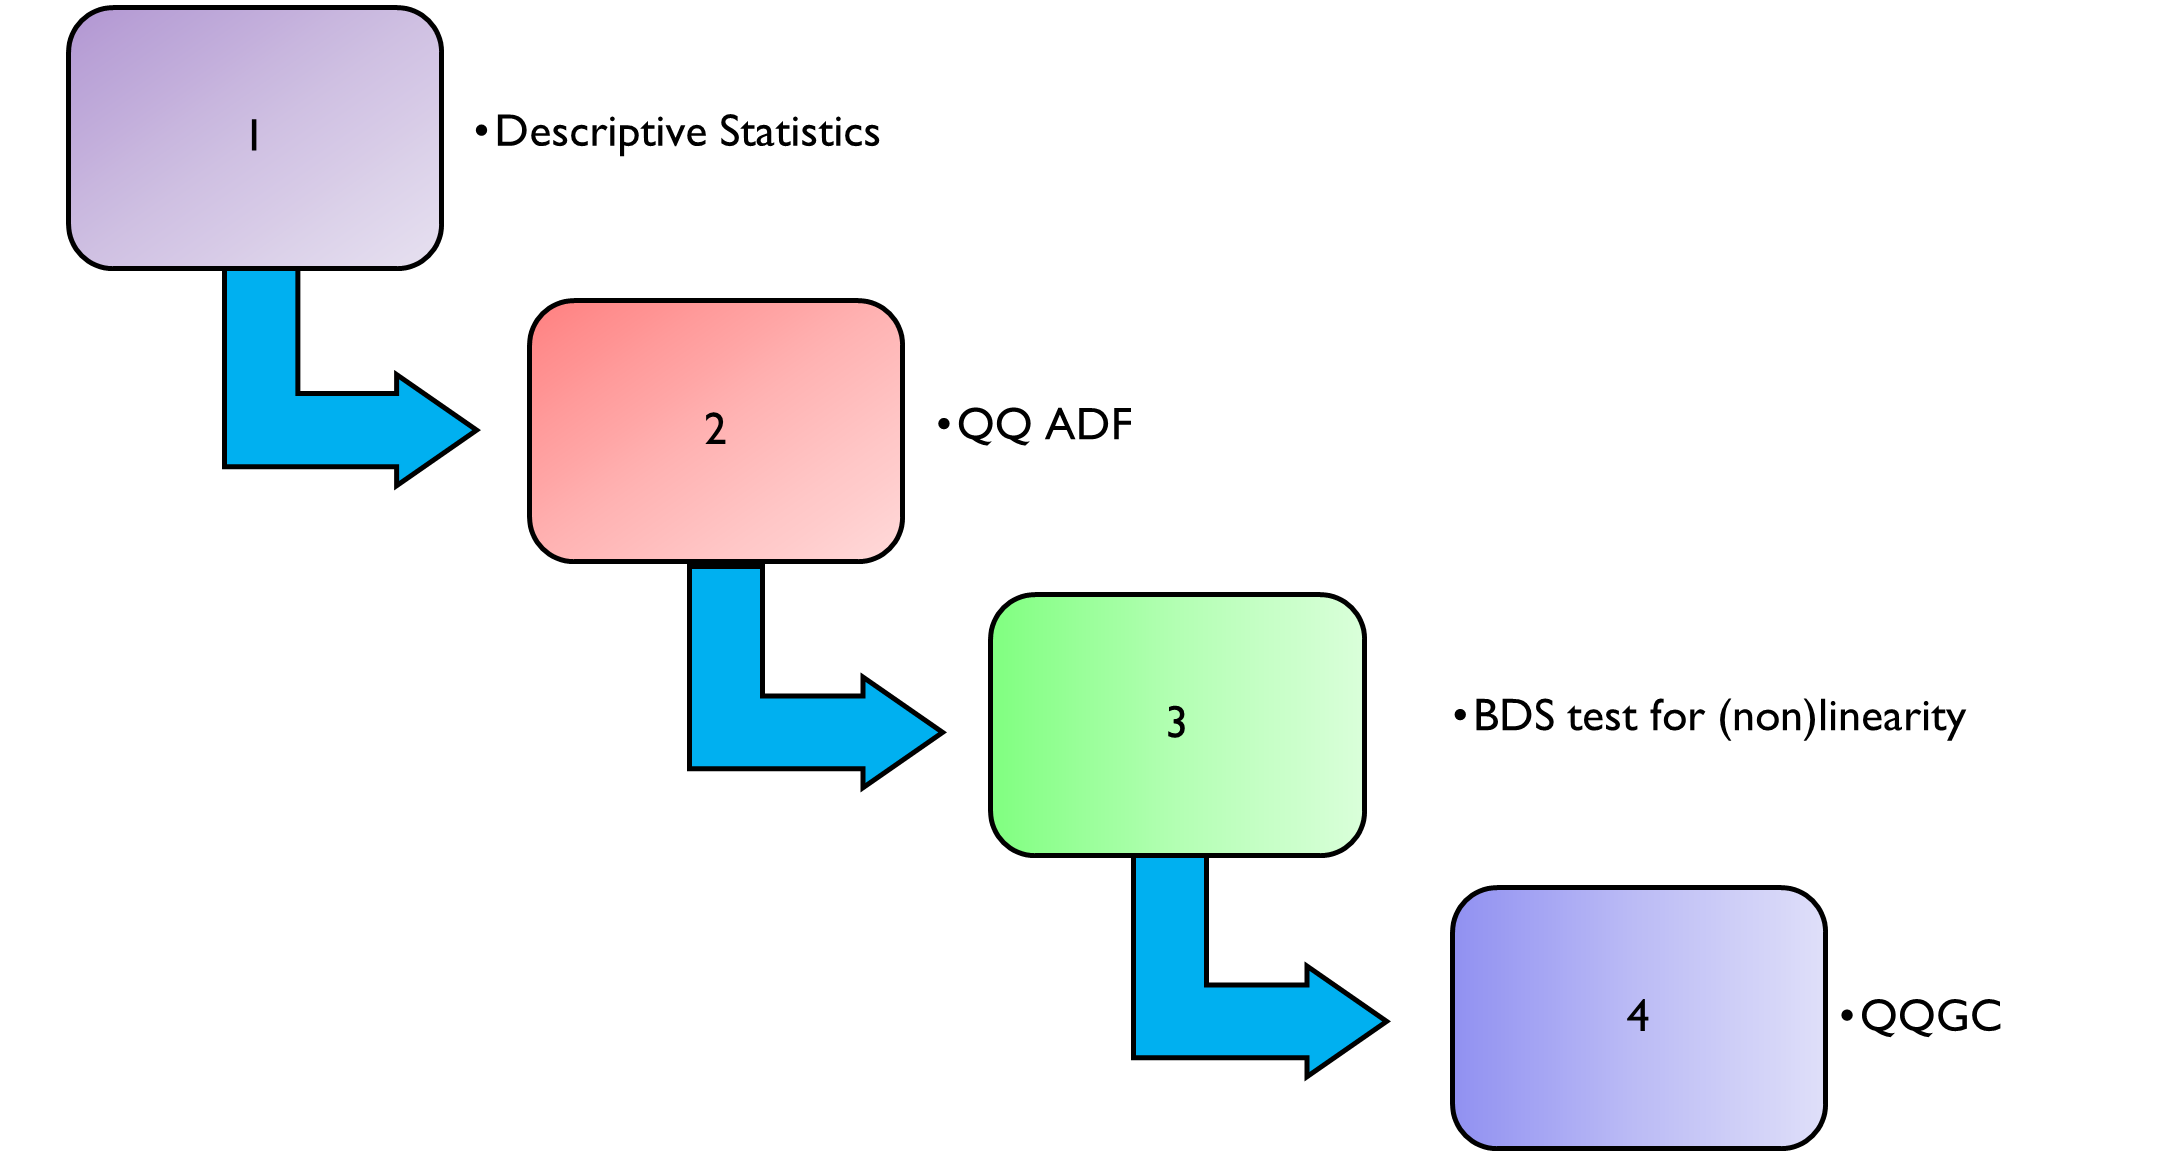
The analysis flow is shown in Figure 3.
Findings and Discussion
Descriptive Statistics
Before delving into the fundamental analysis, it is crucial to gain basic intuitions about the statistical attributes of the data being utilized. Table 2 presents statistical information, including mean, median, minimum, skewness, kurtosis, maximum, standard deviation, and Jarque-Bera, for the quarterly first difference data. RE shows the highest quarterly average, closely followed by GDP, while GPR exhibits the lowest average. EPU demonstrates the highest volatility throughout the sample period, with LF displaying the lowest volatility. The outcomes of the kurtosis and skewness validate the discoveries of nonnormal distribution. The Jarque-Bera normality test results further affirm the indicators' non-normality. These findings suggest that the series demonstrates nonlinearity, thus validating the utilization of quantile-based techniques.
| LF | GPR | EPU | NATR | RE | GDP | |
|---|---|---|---|---|---|---|
| Mean | -0.0010 | -0.0095 | 0.0007 | 3.82E-05 | 0.0050 | 0.0030 |
| Median | -0.0013 | -0.0130 | -0.0240 | 0.0034 | 0.0043 | 0.0036 |
| Maximum | 0.0121 | 0.8988 | 0.7885 | 0.0945 | 0.0398 | 0.0113 |
| Minimum | -0.0085 | -0.4686 | -0.7172 | -0.1350 | -0.0247 | -0.0139 |
| Std. Dev. | 0.0026 | 0.2074 | 0.3047 | 0.0289 | 0.0091 | 0.0026 |
| Skewness | 1.3803 | 0.8852 | 0.4103 | -0.5715 | 0.7931 | -3.3668 |
| Kurtosis | 9.7219 | 6.4773 | 3.0679 | 9.7355 | 7.4409 | 23.961 |
| Jarque-Bera | 173.81 | 50.121 | 2.2326 | 153.63 | 73.200 | 1595.5 |
| Probability | 0.0000 | 0.0000 | 0.3274 | 0.0000 | 0.0000 | 0.0000 |
Nonlinearity Test Outcomes
As previously highlighted, examining descriptive statistics has raised the possibility that the study variables might demonstrate nonlinear features. The BDS linearity test, a method devised by Broock et al. (1996) and previously applied in research studies, is used to validate this observation. The outcomes of the BDS linearity test, as presented in Table 3, unequivocally validate that all the study variables exhibit nonlinearity across the entire sample period. This substantiated nonlinearity underscores the appropriateness of employing the QQGC technique in this investigation. The QQGC technique’s capacity to capture intricate interrelationships, especially in the context of nonlinear data patterns, aligns well with the identified nonlinearity in the series, thus enhancing the robustness of our analytical approach.
| LF | GPR | EPU | NATR | RE | GDP | |
| M2 | 29.485*** | 6.8849*** | 12.863*** | 28.082*** | 25.136*** | 43.647*** |
| M3 | 31.243*** | 5.9813*** | 13.003*** | 29.123*** | 25.998*** | 46.286*** |
| M4 | 33.535*** | 5.1329*** | 13.067*** | 30.243*** | 27.414*** | 49.926*** |
| M5 | 36.976*** | 4.7515*** | 12.900*** | 31.805*** | 30.194*** | 55.376*** |
| M6 | 41.701*** | 6.2735*** | 12.248*** | 33.986*** | 34.297*** | 62.999*** |
| Note: Table 4 presents the z-stats of the BDS test, assessing the null hypothesis of iid. The significance of 1%, 5% and 10% are shown by ***, **, and *. |
Quantile ADF Outcomes
Evaluating the stationarity of the variables is indispensable to safeguard the dependability of findings and prevent spurious outcomes. To address this concern, the QADF test is utilised, as introduced in the study by Adebayo and Özkan (2024). Unlike the traditional ADF, the QADF test demonstrates robustness in the data's presence of non-normality or outliers. It is well-suited for analyzing time series data that deviates from strict normality assumptions. The discoveries of the QADF test are presented in Figure 4.
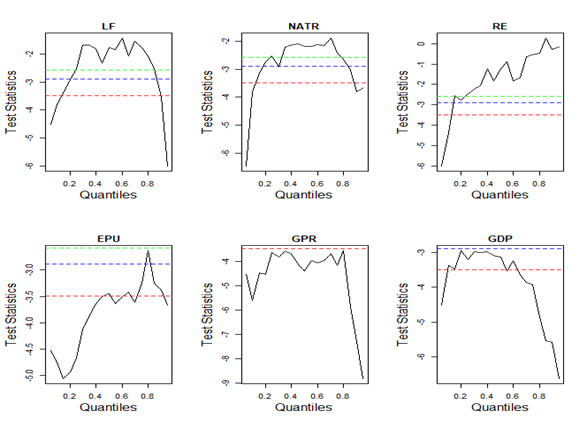
Based on these results, it is concluded that the relevant data series exhibit stationarity at the first difference. This indicates that the succeeding stages of empirical analyses will involve examining data that has undergone first-order differencing to achieve stationarity.
Quantile-on-Quantile Granger Causality Outcomes
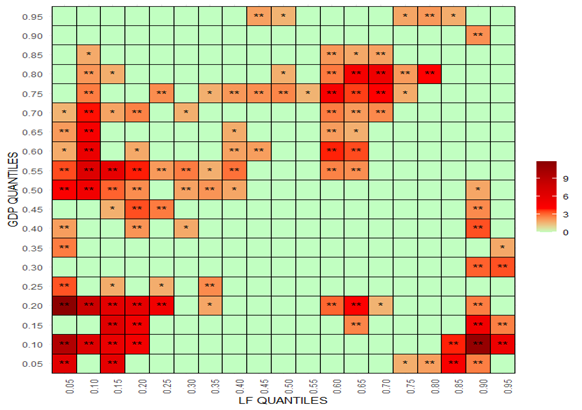
The QQGC is used to explore the predictive power of the regressors, including NATR, EPU, GPR, GDP, and RE, over LF across all quantiles of both dependent and independent variables. The innovative QQGC method, introduced by Adebayo and Özkan (2024), examines the asymmetric impact of exogenous variables’ quantiles on an endogenous variable’s quantiles. Adebayo and Özkan (2024) state that quantile-based methods offer superior accuracy and reliability compared to mean-based regression estimators, primarily due to their consideration of non-linearity and non-normality. Consequently, this approach is more fitting for this study, given the observed non-normal distribution in this dataset. Moreover, the QQGC, by showcasing the influence of quantiles of exogenous variables across quantiles of an endogenous variable, allows to uncover non-linear associations between the variables in this study. The plot illustrates the estimated test statistics for each pairwise quantile series, with the test statistics color-coded in ascending order from green to red. The symbols ** and * indicate 5% and 10% statistical significance levels, respectively.
Figure 5 shows the causal effect of NATR on LF. The results show that NATR Granger causes LF across the majority of quantiles of both LF and NATR; though, there is evidence of strong predictive power of NATR over LF across all quantiles (0.05-0.95) of LF and higher quantiles (0.65-0.95). The results suggest a Granger causal relationship between NATR and LF across a significant portion of their respective quantiles. In other words, the past values of NATR contain information that helps predict or explain variations in LF, indicating a directional influence from NATR to LF. Moreover, the findings suggest that the predictive power of NATR over LF is strong across all quantiles of LF, ranging from 0.05 to 0.95. This implies that the influence of NATR on LF is consistently significant throughout a wide range of LF values. Additionally, the strong predictive power is more pronounced in the higher quantiles, specifically in the range of 0.65 to 0.95, suggesting that the impact of NATR on LF is more substantial during periods of higher LF values. The obtained results align with the studies in the literature (Ahmad et al., 2020; Badeeb et al., 2020; Ibrahim et al., 2022). Environmental quality, which encompasses indicators like soil health, biodiversity levels, water and air quality, and overall ecosystem resilience, is influenced by alterations in the availability or condition of NATR. This underscores the notion of unidirectional causality, suggesting that changes in NATR can have a consequential and persistent impact on the ecological state. Emphasizing the enduring significance of this interrelationship, there is a clear call for sustainable resource management measures to enhance or maintain ecological quality over the long term. Consequently, it becomes imperative for policymakers and the Indian government to institute and enforce policies that champion the sustainable utilization, management, and extraction of natural resources. Additionally, fostering the adoption and development of eco-friendly technologies and practices in industries heavily reliant on natural resources is crucial for promoting environmental sustainability.
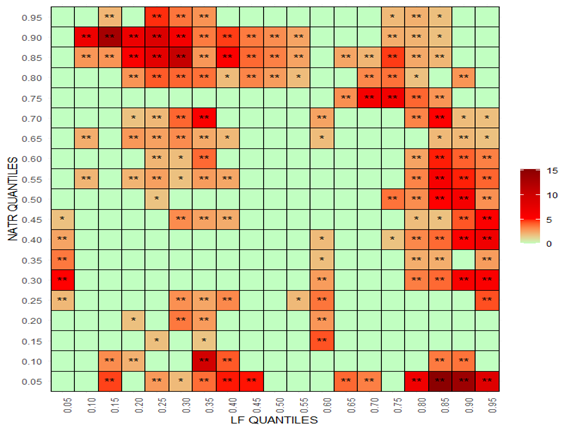
Figure 5 shows the causality from GDP to LF. The result shows that GDP has significant predictive power over LF; thus, economic growth can promote ecological quality. Therefore, policymakers in India need to realign their policies towards sustainable growth. This outcome aligns with the findings reported by Ahmad et al. (2020) but diverges from the results presented by Acheampong (2018) and Akram et al. (2022). Discrepancies in the outcomes can be attributed to variations in the methodology employed, the specific dependent variable under scrutiny, and the timeframe considered for analysis. While India has experienced substantial benefits from rapid economic growth, there is a notable trade-off in environmental challenges, encompassing air, water, and soil pollution (Awan et al., 2022). As a swiftly growing economy with substantial consumption of natural resources and reliance on fossil fuels, India bears the distinction of having the most significant total EF (Apergis et al., 2010). The country’s economic growth strategy notably depends on carbon-intensive energy resources, contributing to the observed environmental challenges. India’s remarkable economic growth, characterised by low-wage labour, resource-intensive production, and exports, has encountered limitations, resulting in discernible social and environmental imbalances (World Bank, 2024). The pursuit of high growth rates, particularly since the 2000s, has led to an expanding ecological deficit and environmental degradation. This underscores the realisation that escalating per capita income does not inherently translate into enhanced environmental quality. Consequently, Indian policymakers are urged to embrace energy-related environmental measures to address the ecological challenges associated with the nation’s growth trajectory.
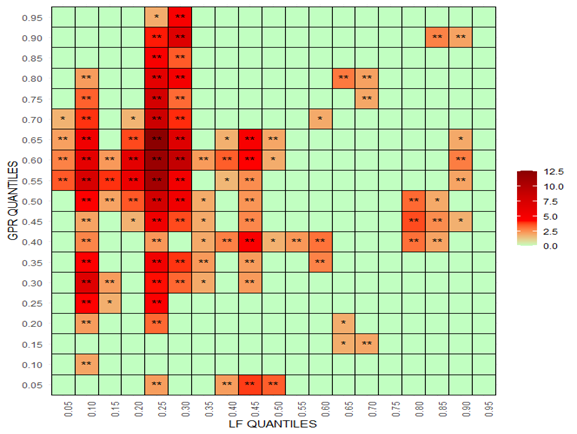
Geopolitical uncertainty may compel or incentivize economic entities to transition toward RE sources (Awosusi et al., 2023). This transition serves as a strategic response, such as enhancing the utilization of RE, which aids in diminishing a nation's reliance on imported gas and oil vulnerable to geopolitical risks (Akram et al., 2020). However, this shift is not an instantaneous process; it requires a substantial period for new investments in renewable power infrastructure, alterations in firms’ production technologies, and the persuasion of clients to modify their consumption habits, among other factors. Over time, a higher proportion of RE resources contributes significantly to curbing ecological damage (Jiao et al., 2022). Furthermore, when a nation experiences prolonged geopolitical risk, citizens defer their current usage and increase precautionary savings. Simultaneously, corporations tend to delay investments or, in extreme cases, permanently close their factories (Alola et al., 2023). Overseas companies may relocate their manufacturing bases to their home nations or nations with greater political constancy. These strategic activities culminate in substantial economic shrinkages and reduced energy usage, leading to lower contamination levels (Li et al., 2023). These assertions find empirical support in the findings of the study conducted by Balsalobre-Lorente et al. (2024), highlighting that the effects of geopolitical risk are more noticeable.
Figure 5 illustrates causality from RE to LF in India. Furthermore, significant causality is observed from RE to LF across most quantiles for both RE and LF, indicating a direct influence of changes in the utilization and adoption of RE on ecological quality indicators. Specifically, an increased use of wind and solar power can contribute to reduced air contamination, improved air quality, and a diminished carbon footprint. Consequently, these findings suggest that renewable sources present a favorable option for decreasing CO$_2$in emerging economies like India. Elevating the proportion of RE in the overall energy mix benefits India, aligning with the pursuit of sustainable development goals (Ameli & Brandt, 2015; Obekpa & Alola, 2023).
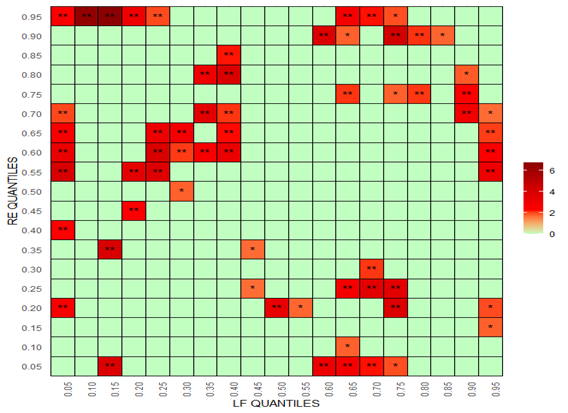
The adoption of renewable energy technologies is commonly associated with a reduced reliance on fossil fuels, resulting in a decline in environmental degradation. This holistic approach encompasses mitigating climate change impacts, preventing habitat destruction, and preserving biodiversity. The identified unidirectional causality from RE to LF aligns with the findings of the studies in the literature, where they also affirmed the predictive power of RE over LF (Huang et al., 2022; Deng et al., 2024). Similarly, the study conducted by Destek and Sinha (2020)Destek and Sinha (2020) corroborated such an impact on LF. The discovery of this investigation is steady with recent inquiries by Kirikkaleli and Sowah (2023), supporting the notion that RE can predict LF, implying that ecological quality can be forecasted based on RE utilization.
Figure 5 illustrates causality from EPU to LF in India. The discoveries reveal a subtle causality between EPU and LF across various quantiles for both EPU and LF. In the context of unidirectional causality, shifts in EPU directly influence ecological quality. This impact can manifest via changes in environmental regulations, the adoption of green practices, and alterations in resource management. Economic measures, particularly those about industrial activities, ecological guidelines, and resource extraction, wield substantial influence over ecological quality.
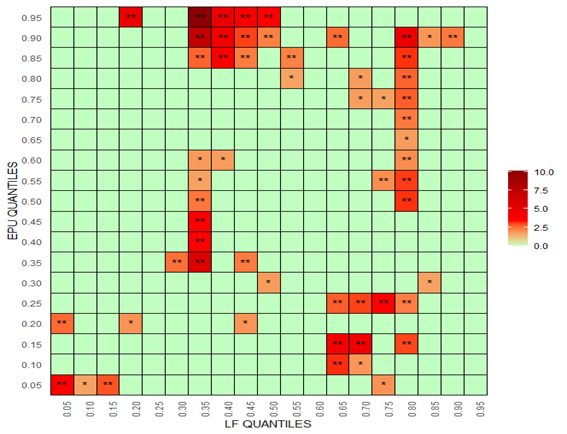
Moreover, policy decisions may, for instance, affect deforestation rates, contamination levels, and overall ecological management initiatives. Additionally, EPU can shape innovation and investment decisions in ecologically pertinent technologies. Heightened uncertainty may result in an unwillingness to invest in sustainable initiatives or RE, possibly compromising overall ecological integrity. Moreover, enterprises grappling with heightened uncertainty might defer their dedication to CO$_2$ monitoring, especially in the face of worsening business conditions (Das et al., 2019). This becomes particularly pertinent when governmental attention shifts away from addressing ecological issues to more pressing political and economic concerns Atsu and Adams (2021). Our findings align with similar results presented in studies conducted by Amin and Dogan (2021) and Balsalobre-Lorente et al. (2024).
Conclusion and Policy Guidelines
Concluding Explanations
Growing levels of CO$_2$ in the atmosphere have precipitated a global climate crisis. While prior studies have identified several drivers of ecological quality/degradation, scant attention is dedicated to the role played by both economic policy uncertainty and geopolitical risk. This oversight persists despite considering the pivotal roles of natural resources, renewable energy, and economic growth. To address this gap, the study utilized quarterly data spanning from 2003 to 2022 to scrutinize the determinants of ecological quality, particularly within the Indian context. Employing the recently introduced QQGC and QADF methods, the study aimed to unveil the causal connections among these variables. The results demonstrate that natural resources, economic growth, renewable energy, economic policy uncertainty, and geopolitical risk all possess predictive power over LF. Consequently, any variations in these variables are poised to substantially impact LF.
This study focuses on uni-directional causality using the QQGC method. Thus, it is important to be aware that environmental degradation may also influence its determinants of economic policy decisions and geopolitical dynamics. More specifically, worsening ecological conditions could be effective in rearranging policies about environmental quality. Although the current methodological framework does not capture potential feedback loops, it is recommended that exploring bi-directional relationships using more dynamic approaches, including time-varying or structural models should be applied in future research.
Policy Guidelines
The policy implications sound a cautionary note and should alert government officials, emphasizing the importance of prioritizing substantive policy function over superficial appearances to achieve carbon neutrality. Firstly, the identified unidirectional causality from RE to ecological quality (proxied by LF) underscores the need for strategic considerations. As firms delay economic activities, resulting in reduced energy usage and lower emissions, a simultaneous lessening impact exists on the ecosystem. While such activities may initially pose challenges to India's economic prosperity, the recommendation is for the Indian government to refocus on alternative strategies for energy use and efficiency, with a specific emphasis on promoting renewables. In this context, certain sectors, such as transportation and industrial manufacturing, may present significant opportunities for improving renewable energy. Electrifying urban transport systems and incentivizing industrial energy efficiency through the use of solar, biomass, and other clean technologies might support emissions reduction without undermining productivity.
Implementing policy measures that incentivize, offer tax holidays, and provide fiscal benefits for RE usage can help achieve India's dual objectives of environmental sustainability and economic growth. Additionally, fostering the adoption of renewables over the long term can serve as a preventive measure against shocks caused by EPU on firms' economic activities. This proactive approach mitigates economic unpredictability in the long run and instils resilience during uncertain times.
Secondly, GPR holds the potential to significantly predict ecological sustainability in India. The plausible explanation for lower emission levels and a reduced ecological footprint during high GPR periods lies in the diminished consumption patterns and investment activities. Elevated GPR levels may discourage international investments in India, as investment decisions often hinge on stable economic and political systems. Consequently, a surge in GPR constrains investment prospects and economic actions, thus exerting a mitigating effect on climate impact. To navigate the delicate balance between preserving economic activities and upholding environmental well-being amidst GPR fluctuations, Indian policymakers should prioritize strategies for R&D investments. Moreover, India can manage GPR-induced shocks by diversifying its energy import sources, strengthening domestic renewable energy capacity, and investing in energy storage technologies. These steps may enhance energy security and reduce exposure to volatile geopolitical environments. Initiatives that expand technological sophistication and foster a more intricate production system can enhance economic complexity, consequently benefiting ecological welfare. Furthermore, during periods of low GPR, the Indian government should judiciously focus on ecological protection, leveraging the heightened economic activities during such phases, which could lead to increased ecological dilapidation. A strategic approach in this direction involves applying a higher tax rate on ecological deterioration during low GPR periods, coupled with tax holidays for investments in RE during high GPR periods. This dual-pronged strategy aims to incentivize nations toward achieving sustainable economic and environmental affluence.
These insinuations highlight a trajectory towards achieving sustainable development goals by promoting economic prosperity, addressing environmental degradation, and advocating for the increased adoption of renewable energy sources. There is a call to expand investments in the renewable sector within the Indian context. This study is a pioneer in recognizing that economic policy uncertainty and geopolitical risk influence environmental quality. With a focus on India, this study recommends future directions, particularly in panel study research, to uncover additional factors impacting environmental sustainability. In terms of methodological contributions, upcoming research could explore wavelet quantile-based approaches to uncover the dynamics of these relationships across different periods and quantiles.
Funding statement
This research did not receive any specific grant from funding agencies in the public, commercial, or not-for-profit sectors.
Conflict of interest
The authors declare that they have no competing interests.
Nomenclature
| ADF | Augmented Dickey-Fuller |
|---|---|
| AMG | Augmented Mean Group |
| ARDL | Autoregressive Distributed Lag |
| BRICST | Brazil, Russia, India, China and South Africa |
| CCEMG | Common Correlated Effects Mean Group |
| CO$_2$ | Carbon Dioxide |
| COP | Conference of the Parties |
| CSARDL | Cross-Sectional Autoregressive Distributed Lag |
| EF | Ecological Footprint |
| EPU | Economic Policy Uncertainty |
| FMOLS | Fully Modified Ordinary Least Squares |
| GC | Granger Causality |
| GDP | Gross Domestic Product |
| GFN | Global Footprint Network |
| GHGs | Greenhouse Gases |
| GPR | Geopolitical Risk |
| LF | Load Capacity Factor |
| MMQR | Method of Moments Quantile Regression |
| NAPCC | National Action Plan on Climate Change |
| NATR | Natural Resources |
| OWD | Our World in Data |
| PU | Policy Uncertainty |
| QADF | Quantile Augmented Dickey-Fuller |
| QGC | Quantile Granger Causality |
| QQGC | Quantile on Quantile Granger Causality |
| R&D | Research and Development |
| RE | Renewable Energy |
| TVP-VAR | Time-Varying Parameter Vector Autoregressive |
| WB | World Bank |


