


Table Of Contents

Abstract
Considering the recent restructuration of environmental, social, and governance (ESG) reports in Türkiye, this study uncovers effectiveness of ESG reports in ESG score estimation across diverse liquidity levels. Accordingly, the study examines four different samples as the full sample, Borsa Istanbul 100 (XU100) index, Borsa Istanbul 50 (XU050) index, and Borsa Istanbul 30 (XU030) index, where 102, 60, 43, and 26 companies exist, respectively. The study considers restructured ESG reports for 2022 and 2023 and performs five different machine learning (ML) algorithms. The findings demonstrate that (i) among all segments, environment segment includes principles that have the highest importance, while social, common, and governance segments follow, respectively; (iii) absolute and relative variable importance of ESG principles differentiate; (iii) super learner (SL) is the best ML algorithm, where its estimative power (R2) is around 95\% for the best estimation. Thus, the results demonstrate that the estimative power of restructured ESG reports in the estimation of ESG scores is quite high. Hence, the study highlights a varying contribution of ESG segments and principles to the ESG scores of the companies and reveals a nonlinear need by companies to focus on highly important ESG principles so that companies can stimulate their ESG scores.
Introduction
Environmental deterioration has sparked interest in management of countries and companies in environmental practices (Özcan et al., 2024; Kartal, 2024). Companies are compelled to present strategies and actions to minimize emissions and take actions to transform business processes with innovations that cause fewer negative externalities (Rzayeva & Huseynova, 2025). Given their significant role in ensuring environmental sustainability, firms are forced to disclose information regarding their sustainability practices (Azmi et al., 2019). Moreover, investors seek information about the corporate governance structures of the firms that they invest in to guarantee safe investments. This will prevent them from corporate scandals and ensure that agents consider the benefits of all stakeholders (Sarıyer & Taşkın, 2022). Investors who wish to make an effect seek firms that are reliant on ESG practices, and many judge these firms by looking at their ESG scores.
The increased attention and sophistication of investors towards ESG issues lead them to understand that firms with strong sustainability practices are more likely to outperform their peers (Çağlı et al., 2023; Zhang & He, 2024). An increasing number of investors invest in ESG-adopting firms, noticing that investment returns and sustainability practices are connected, encouraging the firms to assess the economic value of embedding ESG criteria into their businesses (D'Amato et al., 2024; Ma & Ma, 2024). The literature notes also the resilience of the ESG practicing firms during times of turmoil (Narula et al., 2024) and ESG disclosure is also associated with higher firm performance (He et al., 2022; Veeravel et al., 2023). Contemplating the significance of ESG activities, disclosure of information became another concern affecting the investor decision and there is extensive demand for non-financial information (Ellili, 2022). ESG disclosures communicate a broad spectrum of information about numerous activities that firms might be performing on ESG practices.
Stock market authorities and firms have gradually shifted from providing solely financial information to comprehensive ESG reports to inform all stakeholders about their intangible sustainability practices (Biondi & Bracci, 2018). Rating agencies and regulators also show interest in ESG disclosures to measure the ESG scores of the firms. Firms consider sustainability indices and ESG scores as evidence of their sustainability practices and financial resilience to attract individual and institutional investors (Scalet & Kelly, 2010). BIST is an emerging market with a growing interest in sustainability practices and has introduced several directives related to sustainability activities of firms and disclosure of sustainability information. Understanding the worth of sustainability information, CMB imposed a standardized template for ESG disclosure starting with the year 2022 (CMB, 2022), where Supplementary Table 1 notes the new ESG reporting system and its constituents that gives significant attention to the alignment of the firms’ activities with sustainable development goals. The changed structure of the reporting system allows firms to describe their ESG practices in on a standardized way to provide the stakeholders a better and unified assessment of firms ESG performance.
ESG performance can be tracked through the ESG scores provided by various rating agencies that investigate the ESG information disclosed by firms. However, overall ESG performance does not always act as an indicator of sustainability, as some firms in ESG indices are known to be involved in unsustainable practices (Arribas et al., 2021). Thus, investors must be more concerned about each of the segments in ESG and investigate the activities of firms thoroughly (Cheng & Huang, 2024). Environmental disclosures cover a firm's effect through waste management and energy-water use, along with CG practices. Social disclosures address labor practices, human and employee rights, and diversity initiatives. Additionally, companies provide CG information on board composition, shareholder rights, and regulatory compliance. Each of these segments represents different crucial information, where analysis of these information stands essential for stakeholders.
ESG score estimation can help the stakeholders measure the success of firms concerning ESG segments and might assist investors in evaluating the volatility of cash benefits at different levels of perceived risk (Gillan et al., 2021). Despite the significance of ESG score estimation, the literature, that investigates ESG scores, is not vast. For example, De Lucia et al. (2020) employ various ML approaches to test the effectiveness of ROA and ROE in estimating ESG scores. (García et al., 2020) simulate different clustering scenarios of firms focusing on ESG scores and note that sectoral and financial variables significantly estimate ESG performance in the clusters. Gupta et al. (2021) adopt linear regression and RF to estimate the effectiveness of using profit margin and ROA as ESG score determinants. D'Amato et al. (2021) and D'Amato et al. (2022) use ML approaches on focusing balance sheet and income statement items to estimate ESG scores and note the superiority of the RF algorithm. Raza et al. (2022) perform ML algorithms to utilize financial statement information and note that several earnings indicators are effective in estimating ESG scores, where artificial neural network algorithms beat the other methods. Yu et al. (2022) apply ML algorithms by focusing on the nexus between ESG scores and stock returns. Mohammed et al. (2024) uncover the ESG market in Europe and state that carbon emission allowances cause an increase. Taşkın Yeşilova et al. (2025) use solely past score-based and rating-based ESG performance of firms to estimate future ESG performance for the firms operating in Borsa Istanbul Sustainability Index and adopt four machine learning-based models, namely decision tree, random-forest, k-nearest neighbor, and logistic regressions. The findings indicate that both scores can serve as determinants of future ESG performance.
In addition to these, there have been some recent studies that focus on the link between ESG reports and ESG scores. For instance, Kartal et al. (2024d) adopt an MLP algorithm on the data of PTC, which are included in the BIST Sustainability Index, and note that various ESG constituents are more effective in explaining the overall ESG score. Kartal et al. (2024b) apply an SL algorithm on data of PTC, which are in and out of the BIST CG Index. Shimamura et al. (2025) focus on the link between context-dependent readability in sustainability reports using GPT-4 and ESG scores for US firms. The results indicate that context-dependent readability is very useful in ESG evaluations. Ferjančič et al. (2024) examine ten years of FTSE 350 annual reports using BERTopic to investigate the key ESG reporting trends. The outcomes of the study show that ESG disclosures are mainly driven by regulation and major events like the pandemic. ESG scores display a higher correlation with topics like climate risk and stakeholder engagement, whereas executive remuneration correlates negatively. Huang et al. (2024) consider over 10,000 sustainability reports in the context of China to examine whether the textual features affect ESG scores. The paper shows that the length and completeness of the reports significantly boost ESG scores across rating agencies and concludes the need for firms to adapt sustainability reports to diverse stakeholder expectations. The recent literature emphasizes that ESG reports are not just passive disclosures, but rather they act as strategic tools that directly influence ESG scores. Accordingly, understanding and improving their structural quality is highly significant for firms that aim to improve their sustainability perception among investors and rating agencies.
Given the previous literature it is seen that, while existing studies have employed machine learning algorithms to analyze ESG scores, they predominantly focus on financial statement ratios and often adopt a limited scope by neglecting the role of liquidity in the relationship between ESG disclosures and ESG ratings. Considering this niche, this study aims to investigate the effectiveness of ESG principles in the restructured ESG reports on the estimation of ESG scores across various liquidity levels in Türkiye which has recently introduced regulations aimed at improving the structure of ESG disclosures to enhance their usability for stakeholders. The paper further aims to assess whether different ESG segments have distinct effects on ESG score prediction and evaluate the predictive power of ESG reports using advanced ML techniques across different liquidity levels for PTCs. Thus, this study focuses on the case of Türkiye by adopting various ML algorithms and using data for the years 2022 and 2023. Analysis of the Turkish case is essential since the country has recently introduced regulatory reforms that are targeted at standardizing and improving ESG reporting practices. Despite the growing interest in ESG disclosures, the Turkish context remains underexplored in the literature. Moreover, Türkiye stands as an attractive emerging market for many individual and institutional investors and provides significant profit opportunities. Many firms in BIST are still in the early stages of aligning their sustainability standards with international standards and communication of ESG information is also immature. Stakeholders with varying characteristics demand transparent, comparable, and data-driven evaluation of ESG performance. Given this regulatory transition and the diverse liquidity profiles of firms in BIST, it is particularly important to understand the ESG reports and ESG score estimation relationship. Hence, the study contributes to the literature by demonstrating the high estimation power of restructured ESG reports in estimating ESG scores; identifying various ESG principles to enhance ESG scores that provide significant clues for stakeholders; and using various ML approaches to assess and compare their relative performance in ESG score estimation.
The remainder of the study proceeds as follows: Section 2 details the methodology; Section 3 presents the empirical results; and Section 4 concludes with a discussion, policy suggestion, and future research direction.
Methodology
This study utilizes a structured approach to examine companies' ESG performance of PTC listed based on restructured ESG reports’ indices.
Data Acquisition and Preprocessing
The dataset comprises ESG scores obtained from Refinitiv (2025) and ESG reports sourced from PDP (2025), providing a comprehensive evaluation of sustainability principles. The definitions of variables are given in Table 1.
| Description | Unit | Data Source |
| ESG Scores of Companies | Basis Point | Refinitiv (2025) |
| ESG Reports of Companies on ESG Principles | Multiple Choice | PDP (2025) |
Following the regulatory guidelines issued by the CMB on June 23, 2022, certain companies designated by the CMB are mandated to disclose their ESG reports beginning with the 2022 reporting period (CMB, 2022). These companies must also comply with the revised ESG reporting framework, which presents ESG principles in alignment with the CMB regulation using specific principle codes, as detailed in Supplementary Table 1. This reporting structure offers four response categories: "yes," "no," "partially," and "unrelated," with additional free format text space provided for further explanations.
Given the number of companies and variables, the response options in the ESG reports have been reclassified into a binary format, where “yes” remains unchanged, while “no,” “partially,” and “unrelated” are grouped to ensure a more reliable estimation. Consequently, 55 variables are utilized to assess the ESG scores of companies, which serve as dependent variables, as outlined in Supplementary Table 1.
Additionally, Supplementary Table 2 presents the list of companies included in the full sample, XU030, XU050, and XU100 indexes along with their corresponding ESG scores. The analysis includes companies from the full sample, XU100, XU050, and XU030 indices, with varying degrees of data availability. Four different samples are used for the estimation of ESG scores of companies: Full sample, XU100, XU050, and XU030. Specifically, 60 companies out of 100 in XU100, 43 companies out of 50 in XU050, and 29 countries out of 30 in XU30 are included in the analysis. The input data consists of datasets from the years 2022 and 2023.
Table 2 provides an overview of ESG principles as outlined in the CMB Regulation and their adjusted estimations.
| Segment | # of Principles in | |
| New ESG Reporting Scheme | Empirical Estimation* | |
| COM | 10 | 12 |
| ENV | 25 | 24 |
| SOC | 15 | 17 |
| GOV | 2 | 2 |
| Total | 52 | 55 |
Notes:* denotes the ESG principles are reorganized because some existing principles either encompass multiple issues, are misaligned with other principles, or become redundant under the ESG reporting framework.
The ESG framework comprises four primary segments: COM, ENV, SOC, and GOV. This study adopts a new ESG principle classification, consisting of 52 principles, while an estimation approach suggests a slight variation with 55 principles.
Methodological Approach
A six-step approach is implemented to assess ESG scores of companies, as illustrated in Figure 1.
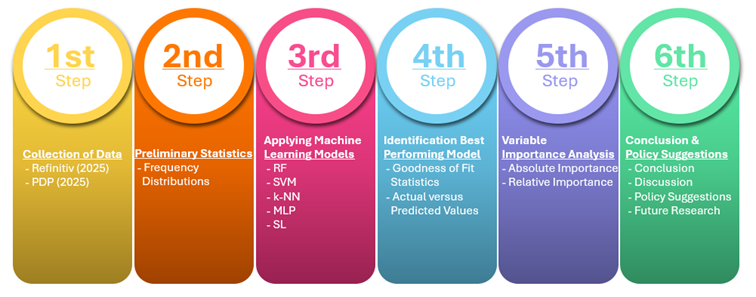
The process begins with data collection from Refinitiv (2025) and PDP (2025), ensuring a comprehensive dataset that includes both quantitative ESG scores and qualitative ESG reports. Once the data is gathered, preliminary statistical analysis is conducted, focusing on frequency distributions, identifying missing values, and ensuring overall data quality in the second step. Following this, in the third step, ML approaches, which include RF, SVM, k-NN, MLP, and SL, are applied to predict ESG scores. These approaches are particularly suited for ESG analysis, as they can capture complex, nonlinear relationships among environmental, social, and governance factors, which traditional econometric approaches often struggle to do as stated in the recent literature (e.g., Ulussever et al., 2023; Kartal et al., 2024; Kartal et al., 2024). The best-performing model is then identified by evaluating goodness-of-fit statistics (RMSE, MAE, and R2) and comparing actual versus predicted values, ensuring that the most reliable and accurate model is used for estimation in the fifth step. To enhance interpretability, a variable importance analysis is conducted, highlighting the absolute and relative significance of different ESG factors in the sixth step. This step provides valuable insights into which indicators have the strongest influence on ESG scores, helping policymakers make informed decisions. Finally, the study concludes with a discussion of findings, policy suggestions, and future research direction.
Unlike traditional econometric approaches, which assume predefined functional forms and rely on strict parametric assumptions, ML approaches can identify hidden patterns, accommodate high-dimensional data, and capture dynamic, nonlinear interactions. Classical approaches often struggle with multicollinearity, heteroscedasticity, etc., limiting their predictive power when dealing with complex ESG data. In contrast, ML algorithms continuously learn from data, improving estimation accuracy without requiring explicit assumptions about relationships between variables. This flexibility makes ML a more robust and adaptive approach for ESG score estimation. By incorporating these advanced techniques, this study ensures a more data-driven, precise, and scalable methodology for evaluating corporate ESG performance. Because of the aforementioned advantages of ML approaches, it is preferred that the ML approaches be employed in this study. Specifically, the RF improves estimation accuracy by aggregating the predictions of multiple decision trees (Breiman, 2001). The SVM aims to balance data fitting and overfitting by applying support vectors and a tolerance margin for estimation (Boser et al., 1992). The k-NN predicts values by averaging the nearest data points(Cover & Hart, 1967). The MLP is a neural network consisting of multiple layers of interconnected neurons, adjusting weights through backpropagation to reduce errors (Rumelhart et al., 1986). The SL model framework, as outlined by Van der Laan et al. (2007) and Van der Laan and Rose (2011), is built on the concept of forming an ensemble model that enhances predictive accuracy by integrating multiple ML algorithms.
The five ML models (RF, SVM, k-NN, MLP, and SL) differ in their principles and strengths. RF, an ensemble decision tree model, is robust against noise and overfitting, making it ideal for large and complex datasets, though it can be slow and difficult to interpret. SVM succeeds in small datasets with nonlinear separations but has problems with scalability and hyperparameter tuning. k-NN, a distance-based algorithm, is simple and requires no training but becomes computationally expensive with large datasets and is sensitive to noise. MLP, a neural network-based model, is powerful for capturing nonlinear relationships and high-dimensional data but is prone to overfitting and requires long training times. Compared to individual models, SL has better generalization since it leverages the strengths of different models, reducing bias and variance. However, it has a higher computational cost and is less interpretable, as it integrates multiple models into a complex framework. To sum up, it can be said that these models represent a broad spectrum of supervised learning techniques that can be applied to both small and big datasets.
Building on the literature, the estimation model can be expressed in Eq. (1):
$\tag{eq:eq1} \text{ESG} = \beta_0 + f(C_1, \ldots, C_{12},\; E_1, \ldots, E_{24}, \\ S_1, \ldots, S_{16},\; G_1,\; G_2) + \varepsilon$
ESG is the dependent variable, the principles of COM, ENV, SOC, and GOV segments are independent variables, \beta_0 is the intercept term, and $\varepsilon\ \text{is}$the error term.
Empirical Results
Empirical results start with the summary of variables used in the analysis of different samples. Then the findings of the ML algorithms, model performance comparison, and the result of variable importance analysis are provided in detail.
Supplementary Table 3 presents the descriptive statistics of the ESG principles and ESG scores across the samples and years in detail. On the other hand, Table 3 presents a summary of ESG scores and segment breakdowns for different sample groups (Full Sample, XU100, XU050, and XU030) over the years 2022 and 2023.
| Sample | Year | ESG Score | Segment | |||
| COM | ENV | SOC | GOV | |||
| Full Sample | 2022 | 63.79 | 75.41% | 64.99% | 83.33% | 87.75% |
| 2023 | 64.54 | 80.56% | 69.85% | 87.49% | 90.20% | |
| XU100 | 2022 | 67.18 | 78.75% | 67.99% | 86.08% | 87.50% |
| 2023 | 69.53 | 84.58% | 74.72% | 90.39% | 91.67% | |
| XU050 | 2022 | 70.98 | 83.72% | 74.03% | 90.15% | 90.70% |
| 2023 | 73.38 | 88.95% | 80.33% | 92.34% | 94.19% | |
| XU030 | 2022 | 67.95 | 81.32% | 72.27% | 87.63% | 89.66% |
| 2023 | 71.04 | 86.49% | 78.16% | 90.47% | 94.83% |
Before running ML approaches, the dataset is split into training and testing sets in a way that aligns with the distribution of the dependent variable to prevent overfitting. The training set comprises 80% of the dataset, while the testing set accounts for the remaining 20%. Also, a 5-fold and 5-repeat cross-validation process is employed. This approach aims to generate more robust predictions using ML that do not rely on strict distributional assumptions. Model fit criteria such as R2, RMSE, and MAE are calculated and analyzed to compare the performance of different approaches. Accordingly, the model performance metrics are shown in Table 4.
| Sample | Model | SL weight | Training Set | Testing Set | ||||
| R$^2$ | RMSE | MAE | R$^2$ | RMSE | MAE | |||
| Full | RF | 54% | 93.86% | 6.152 | 4.389 | 82.46% | 8.571 | 6.903 |
| SVM | 28% | 94.52% | 5.541 | 3.606 | 79.23% | 9.628 | 6.804 | |
| k-NN | 15% | 90.81% | 7.354 | 4.752 | 76.95% | 9.841 | 6.844 | |
| MLP | 3% | 58.02% | 30.240 | 23.005 | 72.99% | 10.840 | 7.648 | |
| SL | - | 94.59% | 5.987 | 4.178 | 82.92% | 8.377 | 6.672 | |
| XU100 | RF | 61% | 92.96% | 6.107 | 4.261 | 83.39% | 9.357 | 7.208 |
| SVM | 15% | 96.22% | 4.317 | 2.677 | 65.94% | 11.812 | 7.533 | |
| k-NN | 24% | 86.32% | 8.267 | 5.772 | 77.80% | 9.799 | 7.383 | |
| MLP | 0% | 67.81% | 70.575 | 67.086 | 25.03% | 72.166 | 69.372 | |
| SL | - | 93.52% | 5.888 | 4.129 | 84.45% | 8.970 | 7.015 | |
| XU050 | RF | 17% | 92.27% | 4.926 | 3.052 | 82.33% | 11.546 | 7.642 |
| SVM | 9% | 93.45% | 4.530 | 2.378 | 80.04% | 12.854 | 8.739 | |
| k-NN | 74% | 92.24% | 5.042 | 2.710 | 90.22% | 10.718 | 8.016 | |
| MLP | 0% | 76.84% | 73.151 | 71.034 | 4.99% | 74.672 | 72.814 | |
| SL | - | 92.73% | 4.439 | 2.591 | 90.31% | 5.776 | 2.244 | |
| XU030 | RF | 63% | 91.65% | 5.783 | 3.665 | 90.94% | 6.388 | 5.178 |
| SVM | 29% | 91.38% | 5.727 | 2.559 | 88.10% | 7.252 | 5.702 | |
| k-NN | 8% | 83.53% | 9.020 | 5.468 | 78.08% | 11.185 | 8.559 | |
| MLP | 0% | 31.64% | 42.264 | 39.542 | 65.02% | 41.333 | 37.789 | |
| SL | - | 91.94% | 5.688 | 3.335 | 91.13% | 6.289 | 2.160 |
Notes: RF: # of trees: 500, # of nodes:37, mtry:55 / SVM: degree: 1-3, Scale: 0.001, 0.010, and 0.100, C: 0.25, 0.50, and 1.00 / k-NN: kmax: 9, distance: 2, kernel = optimal / MLP: layer1: 60, layer2: 40, and layer3: 20
Table 1 provides a comprehensive evaluation of ML approaches applied to different samples, analyzing their model performance based on R2, RMSE, and MAE for both training and testing datasets. Across all samples, SL consistently outperforms other approaches, demonstrating its superiority in predictive accuracy and generalization in both training and testing sets. While RF and SVM generally show strong results, MLP performs the worst in each sample, exhibiting high error rates and poor predictive power. These results are in line with the literature as well (Kartal et al., 2024; Kartal et al., 2024). Specifically, in the full sample, SL achieves the highest testing R2 (82.92%), outperforming all individual approaches. Among the base approaches, RF proves to be the strongest, with a test R2 of 82.46%, followed by SVM (79.23%) and k-NN (76.95%). However, SVM and k-NN exhibit signs of overfitting, as they achieve a high training R2 but drop significantly in testing. On the other hand, MLP performs the weakest, with a test R2 of 72.99% and the highest RMSE (10.840) and MAE (7.648), indicating poor generalization. SL maintains the lowest error rates (RMSE: 8.377, MAE: 6.672), reinforcing its effectiveness as an ensemble model. These results indicate that SL provides the most robust predictions.
SL consistently outperforms individual approaches across all other samples, achieving the highest test R2 and the lowest RMSE and MAE, making it the most reliable model. In the XU100 sample, RF performs well (83.39% testing R2), while SVM shows severe overfitting, and MLP completely fails with a low testing R2 of 25.03% and high RMSE (72.166). For the XU050 sample, SL again delivers the best results (90.31% testing R2), with k-NN performing exceptionally well (90.22% testing R2), whereas MLP remains the weakest (4.99% testing R2 and highest RMSE of 74.672). In the XU030 sample, SL leads with 91.13% testing R2, while RF follows closely at 90.94%. k-NN experiences some overfitting, and MLP, though slightly better than in other samples, still performs poorly (65.02% testing R2). These findings confirm that SL is the most effective model, RF is the strongest individual model, and MLP consistently fails to generalize.
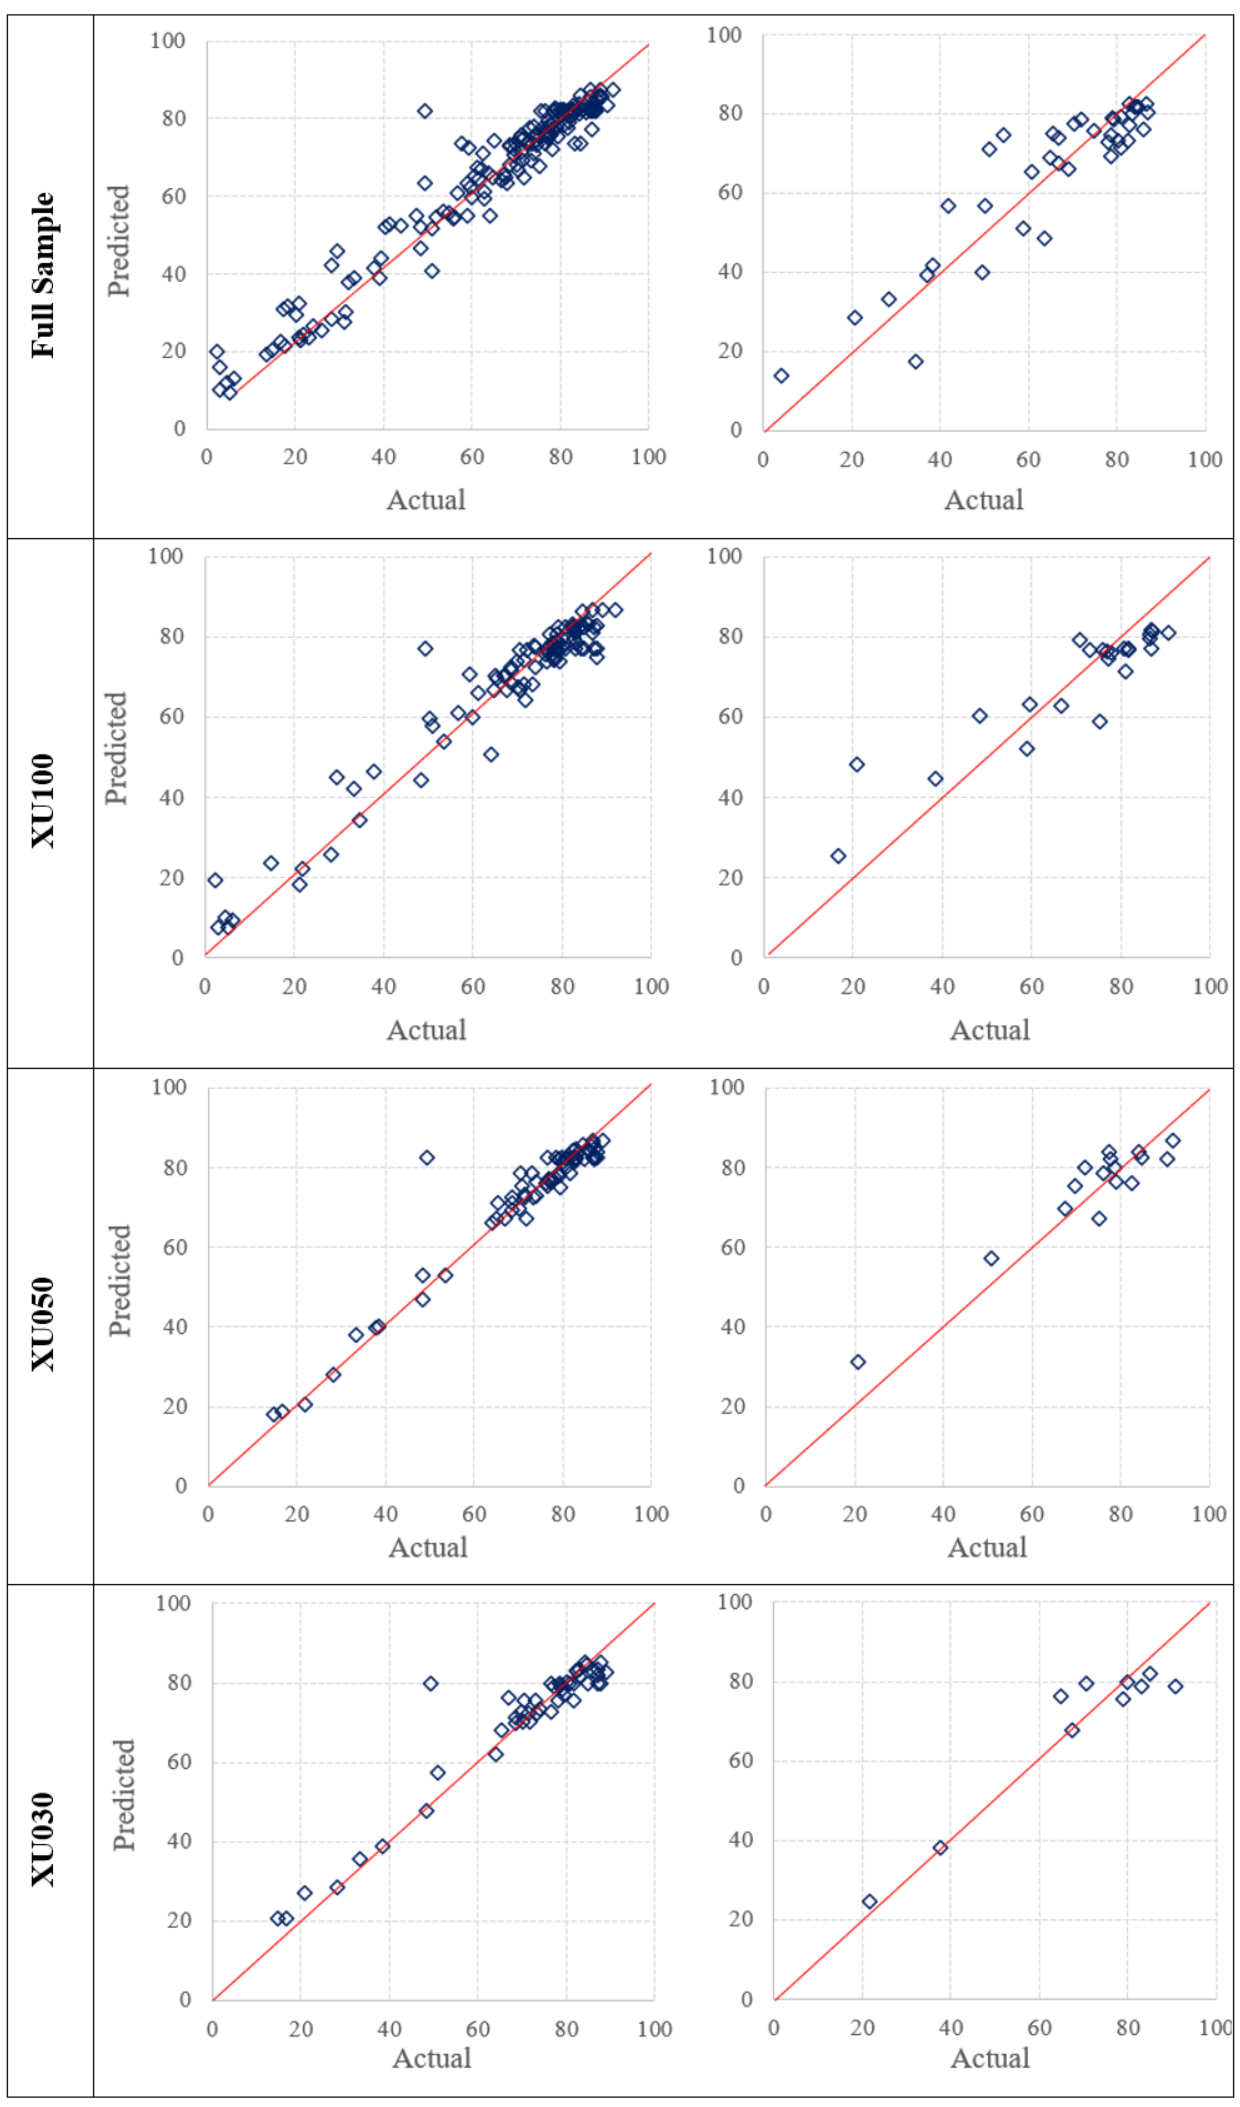
These findings suggest that ensemble learning through SL is the most effective approach for improving prediction accuracy and minimizing errors rather than choosing a single model. Figure 2 depicts the actual versus predicted values for the best-performing ML model (SL) for each sample.
After implementing the best-performing model (SL), an absolute and relative importance analysis is conducted as the fifth step in the flowchart of the methodology (Wei et al., 2015). The absolute importance of segments for each sample is presented in Table 5.
| Segment | Full Sample | XU100 | XU050 | XU030 |
| ENV | 58.9 | 61.6 | 54.8 | 49.6 |
| SOC | 26.3 | 19.5 | 25.6 | 32.4 |
| COM | 13.5 | 18.2 | 17.8 | 17.2 |
| GOV | 1.2 | 0.7 | 1.9 | 0.8 |
| Total | 100.00 | 100.00 | 100.00 | 100.00 |
In Table 5, it is shown that the importance values represent the contribution of each segment to the overall ESG score, highlighting key areas influencing the model's predictions. ENV has the highest importance across all sample groups, reinforcing its crucial role in ESG evaluation. In the Full Sample, ENV contributes 58.93%, and it reaches the highest importance at 61.61% in XU100, suggesting that environmental factors play a major influence in shaping ESG performance. Although its importance is slightly lower in XU050 (54.77%) and XU030 (49.56%), it remains the most influential segment. SOC exhibits significant variation across different sample groups. In the Full Sample, it holds 26.32% importance, but its role changes when looking at specific groups. In XU100, SOC has the lowest importance (19.47%) but, in XU030, SOC has the highest contribution at 32.4% among all samples. COM consistently contributes between 13.53% and 18.21% across all sample groups. XU100 has the highest importance (18.21%), while XU030 records a slightly lower value (17.24%). This suggests that in larger and more diversified indices like XU100 and XU050, COM plays a more significant role compared to XU030. GOV has the lowest importance across all sample groups, with values ranging from 0.71% (XU100) to 1.90% (XU050), confirming that governance factors contribute minimally to the overall ESG performance in this dataset. These results, from the most important to the least important on the ESG score, ENV, SOC, COM, and GOV, have also been emphasized in some studies in the literature (e.g., Sarıyer & Taşkın, 2022; Kartal et al., 2024; Kartal et al., 2024; Mashayekhi et al., 2024).
The variable importance analysis is calculated for each sample and details are given in Supplementary Table 4. In the full sample, the most critical variable is ENV15, emphasizing the necessity for companies to disclose their Scope-1 and Scope-2 energy usage. Additionally, SOC9 holds substantial weight, indicating that accident prevention and occupational health disclosures are vital across all industries. Other significant environmental metrics include ENV7 and ENV21, demonstrating the growing investor and regulatory focus on climate effect.
The XU100 index, which comprises the top 100 companies in BIST, shows a distinct prioritization of energy and emissions-related disclosures. Unlike the full sample, XU100 places a much higher emphasis on ENV18, signifying a shift towards sustainable energy strategies among large-cap firms. Furthermore, COM12 plays a crucial role, indicating that external validation of sustainability efforts is becoming a market expectation. While SOC9 still holds relevance, it is less emphasized compared to environmental transparency.
In the XU050 sample, which consists of mid-to-large-cap companies, there is a distinct focus on environmental cost savings and sustainability performance metrics. The most significant variable is ENV14, indicating that firms are highly incentivized to report cost-effective sustainability projects. Furthermore, the integration of ESG criteria into ENV3 is a notable factor, reflecting a strong push for accountability in corporate governance structures. Interestingly, ENV21 is also highly important, suggesting that companies in this segment are actively preparing for potential carbon regulation. Compared to XU100, XU050 firms emphasize financially quantifiable sustainability efforts rather than broad environmental policy disclosures.
The most critical ESG factor in the XU030 sample is the SOC1, showing that large corporations are placing increasing importance on ethical labor practices and stakeholder rights. Moreover, COM12 holds substantial weight, reinforcing the trend of external accountability and transparency in top-tier firms. Unlike XU100 and XU050, XU030 exhibits a lower emphasis on direct environmental metrics but a stronger inclination toward ESG integration in corporate policies and third-party assurance mechanisms. This pattern suggests that market leaders are shaping sustainability strategies around governance, ethics, and transparency rather than just environmental effects.
Conclusion, Discussion, Policy Suggestions, and Future Research
Conclusion and Discussion
The world, all countries, companies, and people have been facing critical climate-related issues over the recent years, which have resulted from adverse environmental problems. Consistent with this forcing fact, both international and national authorities have been trying to slow down climate change and decrease environmental issues by stimulating much more eco-friendly manner for countries, societies, companies, and people so that economies can be decarbonized (Banerjee et al., 2024). Accordingly, a set of various initiatives, such as climate agreements, have been started to make a positive contribution to these efforts. Among all, sustainable development goals aim to turn economies into green and support eco-friendly manufacturing approaches and technologies.
Although applying positive efforts is important for all countries, it is much more critical for developing countries because they have a developing economic structure, where their economic transformation into eco-friendly ones has not been still completed (Aqeeq et al., 2023). In this context, the study focuses on Türkiye's case because it takes place among the leading developing countries and made a regulation recently to restructure ESG reports into much more regularized ones so that they can be appropriate to be analyzed by stakeholders.
While country-level activities have been gaining speed in recent years, similar to those, company-level initiatives have also been developing. In addition to all efforts, developing the ESG disclosures of companies, which are highlighted by the United Nations (2006) and are directly related to the activities performed by the companies, is critical to understanding which activities are realized by companies to deal with environmental and climatic issues because ESG disclosures include information about the environment, social, and governance-related activities of companies on a yearly basis. Also, ESG scores of companies, which are rated by different international firms, reflect how companies have been successful in terms of their ESG practices. Hence, it can be argued that there is a close nexus between ESG reports and ESG scores of companies and an investigation of such a nexus is highly valuable because such a nexus has the potential to affect the decision of stakeholders, which includes investors, traders, and shareholders (Sarıyer & Taşkın, 2022). Moreover, the relationship between ESG scores and ESG reports across varying liquidity levels remains largely overlooked in the existing literature, pointing to a notable gap that this study aims to address. Accordingly, this paper is one of the first to examine the nexus between ESG reports and ESG scores across various liquidity levels by utilizing restructured ESG reports published by PTCs in Türkiye. The study goes beyond standard ESG measures towards new approaches by applying ML algorithms to analyze these restructured reports, offering a novel perspective on how report quality and firm liquidity interact in shaping ESG evaluations.
Considering all the above mentioned points, this study empirically examines the nexus between ESG reports and ESG scores of PTC in Türkiye. Consistently, the study considers four different samples as the full sample, XU100, XU050, and XU030 index, where 102, 60, 43, and 26 PTC exist, in order, so that the nexus between ESG reports and ESG scores of companies can be examined across various liquidity levels of the companies. Also, the study considers restructured ESG reports for the years 2022 and 2023 and performs five different ML algorithms by using ESG scores (ESG principles) as the dependent (independent) variables.
Following up a comprehensive empirical examination, the study empirically reveals that RF algorithms have a quite high estimation power. Among all ML algorithms applied, SL is the best ML algorithm, where its estimative power (R2) is around 95% for the best estimation, whereas the remaining ML algorithms have a relatively low power either in training or test data sets. So, the results demonstrate that the estimative power of restructured ESG reports in the estimation of ESG scores is quite high. Also, the environment segment includes principles that have the highest importance among all segments, while social, common, and governance segments come after, respectively. Moreover, the absolute and relative variable importance of ESG principles differentiate across sample sets, which implies the changing effect of liquidity level on the nexus between ESG reports and ESG scores of the companies. Specifically, the principle ENV15, which is related to the disclosure of energy utilization data and emission from energy in Scope 1 and 2, is the most important ESG reporting principle for the full sample and XU100 sample. However, ENV14, which is related to several actions taken to mitigate environmental impacts, is the most important for the XU050 sample, while SOC1 is highly critical for the XU030 sample. The similar difference across sample sets is valid also for the subsequent ESG reporting principles. Thus, the study highlights varying contributions of ESG segments and principles to ESG scores of the companies and reveals a nonlinear approach needed by companies through focusing on highly important ESG principles so that companies can stimulate their ESG scores by prioritizing the most significant ESG principles for themselves. In this way, the results empirically reveal that ESG scores of PTC can be estimated through the use of ESG reports, which is consistent with the current literature (Aydoğmuş et al., 2022; Sarıyer & Taşkın, 2022; Kartal et al., 2024; Kartal et al., 2024).
In the current literature, the previous studies (Aydoğmuş et al., 2022; Kartal et al., 2024; Kartal et al., 2024; Mashayekhi et al., 2024) have some deficiencies, such as focused on mainly financial statement ratios, having narrow scopes by not considering the role of liquidity level, & performing limited econometric approaches/ML algorithms (e.g., panel data econometrics, cluster analysis, MLP, SL, or k-means cluster analysis). Different from previous ones, this study focuses on investigating the nexus between ESG reports and ESG scores across various liquidity levels of the companies by performing five ML algorithms on four different sample sets, which include novel and restructured ESG data for the years 2022 and 2023. Hence, this study makes a significant contribution to the current body of knowledge and global and local ESG practices by demonstrating the high estimation power of restructured ESG reports in the estimation of ESG scores; using five ML approaches to assess and compare their relative performance in the estimation of ESG scores; and identifying much more important ESG principles across various liquidity levels, which should be prioritized by the PTC, to enhance ESG scores of the companies, providing significant clues for the companies and stakeholders.
Policy Suggestions
Through performing various ML algorithms and using novel data sets, the study obtains high estimative results, which can be relied on to suggest various policy suggestions for stakeholders that include policymakers, companies, investors, and traders as well.
Firstly, because the study demonstrates that restructured ESG reports have a high estimation power in the estimation of ESG scores of the companies, it is critical for the companies to take this critical point into consideration in ESG-related management and decision approaches. In this context, the companies should position ESG-related issues in their agendas as a prioritized item so that they can put good ESG-related practices into effect. Hence, they can prepare and publish much better ESG reports, where they can make a positive impact on the ESG scores of the companies.
Secondly, since the study reveals that the significance of each ESG segment and ESG reporting principles varies, it is also important to state within the prioritization of ESG-related practices in management agenda that, companies should the most important ESG principles as prioritized to be completed. Then, companies should deal with these ESG principles first, and then go on dealing with the other ESG principles that have less importance on the ESG scores of the companies. Hence, companies can have the opportunity to complete the lack point rapidly by focusing on the highly significant ESG principles, which can make a much more increasing impact on the ESG scores of the companies.
Thirdly, because the study shows that ESG reports have a high estimation capability on the ESG scores, the companies can use ESG reports as a strategic tool as pioneering indicators in foreseeing the progress of ESG. Through the completion of lack points or developing the ESG principles, companies can have higher ESG scores, which may increase the interest of potential stakeholders, such as investors and traders, in the company. It is crucial for companies to keep in mind that ESG is a key point for most investors.
Fourthly, since the study empirically reveals the changing impact across various liquidity levels, the companies should take the liquidity level themselves in BIST in case of taking action for ESG-related issues. This critical point can play a lighthouse role for the companies, where they should define the ESG principles that they have to deal with first. If the companies do not consider the liquidity level that they are in, it is not possible to determine the correct ESG principles that they should try to complete or develop to obtain much better ESG scores through ESG reports. In this context, companies should not forget that the importance of ESG principles in the environment (social) segment decreases (increases) as the liquidity level of companies in BIST increases, which highlights the altering impact of ESG principles on ESG scores across changing liquidity levels of the companies. For instance, ENV15 is the most important ESG principle for both the full sample and XU100 samples, whereas ENV14 and SOC1 are the most important ones for XU050 and XU030 samples, respectively. Because the same condition is similar for remaining ESG principles, companies should care highly about this important point in terms of ESG reports and ESG score management.
Fifthly, considering the critical role and importance of ESG reports for stakeholders, companies’ managements can position the accuracy of ESG reports as an important priority for themselves. In this context, it can be stated that both internal and/or external auditors of the companies can audit the content of ESG reports as part of assurance programs. In this way, companies can increase the reliability of their ESG reports and support the increase in ESG scores.
Sixthly, because ESG reports and ESG scores of the companies are not only for companies but also sectors, financial markets, economies, and countries through investment inflow and market cap, it is critical for policymakers to work on the regulatory framework of ESG reports so that the new reporting scheme can be developed constantly. In this context, it is possible to say that policymakers can further extend the scope of recently restructured ESG reports. On the other hand, policymakers can extend their role beyond the regulation of ESG reports. For instance, policymakers (CMB in this case) can consolidate ESG reports of all PTC, make a big data analysis on such consolidated data, define the deficient/lacking points by using such consolidated data, and make necessary development decisions on restructured ESG reports so that they can have a much better content and function for companies, sectors, financial markets, economies, and countries as well.
Lastly, it is important for all stakeholders that stakeholders should care about different estimation models, as some of them perform better than others across samples. So, stakeholders have to consider the multiple applications of estimation models and benefit from the best one in the estimation of ESG scores, which are beneficial in making better decisions for investment and portfolio diversification. Also, stakeholders can focus on the most important ESG principles in ESG reports in terms of making any decisions for the companies. Even, stakeholders, especially investors, may consider various ESG principles as more important for companies’ facilitation across different sectors as compatible with their sectors.
Limitations and Directions for Future Research
In uncovering the nexus between ESG reports and ESG scores, the study follows up a comprehensive approach from both theoretical and practical perspectives by considering the case of Türkiye, where ESG reports were recently restructured and PTC has been using these restructured ESG reports schemes since 2022. Although the best effort is made in this study, nevertheless, this study inevitably has some limitations that can be considered as future research directions by scholars.
The first limitation is that the study focuses on examining PTC in BIST (i.e., the case of Türkiye) across various liquidity levels. In this context, four sample sets are used, where 102, 60, 43, and 29 PTC are considered in the full sample, XU100, XU050, and XU030, respectively. However, it is known that there are many more PTCs in BIST. Therefore, new studies can include other PTCs that are not included in this research. In this way, new studies can focus on other perspectives than the liquidity level of PTC since there are other BIST indices, which represent other focus points. Also, new studies can make a compression between PTCs and non-PTCs in the investigation of the nexus between ESG reports and ESG scores because some non-PTC have been disclosing their ESG reports. Moreover, new studies can look for the opportunity to apply such concepts to other developed as well as developing countries if there can be found data for restructured ESG reports comparatively.
The second limitation is that this study considers the PTC in a specific BIST index as a whole. However, there are PTCs from various economic sectors (e.g., automotive, banking, insurance, etc.) in each BIST index. Accordingly, new studies can consider such sector-based differences between PTC, and new studies can be designed to uncover the nexus between ESG reports and ESG scores across economic sectors.
The third limitation is that company-based factors (e.g., asset size, market cap, shareholder structure, share turnover, board structure, CG practices) may have either a positive or a negative moderating effect on the nexus between ESG reports and ESG scores. Therefore, new studies can consider such country-based characteristics in empirical research.
The fourth limitation is that although this study applies a total of five different ML algorithms, there are still other approaches (e.g., Long-Short Term Memory & Multivariate Adaptive Regression Splines). For this reason, such ML approaches can be used in new studies and the unique characteristics of these approaches (e.g., as definition of critical thresholds for each ESG principle and determination of interaction between the ESG principles) can be beneficial in future studies.
The fifth limitation is that this study uses ESG scores, which are obtained from Refinitiv (2025) by considering that this study focuses on PTC in BIST and BIST uses ESG scores of Refinitiv (2025) in evaluation companies within the scope of BIST Sustainability Index. However, there are other data sources (e.g., Bloomberg, MSCI, S&P Global, & Sustainalytics) that provide ESG scores for PTC based on different approaches. Accordingly, new studies can use either such alternative data sources instead of Refinitiv (2025) or consider multiple data sources simultaneously by searching the consistency of the results across ESG scoring approaches of these sources.
The sixth limitation is that this study mainly focuses on the nexus between ESG score reports and ESG scores across various liquidity levels. In doing this, however, the study does not consider the country's (i.e., Türkiye's) background such as socioeconomic, regulations, and policies explicitly. So, new studies may include some additional factors to consider these points in empirical modeling.
Lastly, new studies can work with much newer data considering that this study uses data for the years 2022 and 2023 because data for the year 2024 has not been published when this study is prepared. Also, because this study works with yearly data, new studies can work with much higher frequency (i.e., quarterly & monthly) if possible.
Above-explained limitations can be included in the formulation of new research. With the consideration of these limitations in new studies by incorporating them into the scope of the new investigation, the knowledge on estimating ESG scores based on ESG reports can be extended much more. Thus, the knowledge on the issue can be extended further by presenting insights from the inclusion of the aforementioned points as the directions for future research.
Supplementary Material
Supplementary material is available online at: https://doi.org/10.51300/JSE-2025-154
Conflict of Interests
The authors declare that they have no competing interests.
Funding Statement
This research did not receive any specific grant from funding agencies in the public, commercial, or not-for-profit sectors.
Disclosure Statement
The authors certify that they have NO affiliations with or involvement in any organization or entity with any financial interest (such as honoraria; educational grants; participation in speakers’ bureaus; membership, employment, consultancies, stock ownership, or other equity interest; and expert testimony or patent-licensing arrangements), or non-financial interest (such as personal or professional relationships, affiliations, knowledge or beliefs) in the subject matter or materials discussed in this manuscript.
Nomenclature |
|
|---|---|
| Abbreviations | |
| BIST | Borsa Istanbul |
| CG | Corporate Governance |
| CMB | Capital Markets Board |
| ESG | Environmental, Social, and Governance |
| k-NN | k-nearest Neighbor |
| MAE | Mean Absolute Error |
| ML | Machine Learning |
| MLP | Multi-layer Perceptron |
| PDP | Public Disclosure Platform |
| PTC | Publicly Traded Companies |
| ROA | Return on Assets |
| ROE | Return on Equity |
| RMSE | Root Mean Square Error |
| RF | Random Forest |
| SVM | Support Vector Machines |
| SL | Super Learner |
| XU030 Index | BIST 30 Index |
| XU050 Index | BIST 50 Index |
| XU100 Index | BIST 100 Index |
| Main Segments in ESG Reports | |
| COM | Principles in Common Segment |
| ENV | Principles in Environment Segment |
| SOC | Principles in Social Segment |
| GOV | Principles in Governance Segment |
References
|
Supplementary Material(s) |
Download |
|---|---|
|
Supplementary Materials |

About contributors

Serpil Kılıç Depren
Department of Statistics,Yıldız Technical University, Istanbul,Türkiye
Turkey
Dilvin Taşkın
Department of International Trade and Finance,Yaşar University, Izmir,Türkiye
Turkey
Talat Ulussever
Department of Economics, Boğaziçi University, Istanbul,Türkiye
Turkey