


Table Of Contents

Abstract
Identifying the causes of environmental pollution that accompany economic growth has become a crucial issue. This study aims to determine the relationship between environmental pollution, agriculture, energy, and growth in Türkiye from 2000 to 2020. Another aspect of the research is to investigate whether the Environmental Kuznets Curve (EKC) hypothesis is valid for Türkiye. The study is significant due to the limited number of studies examining the environmental impact of agricultural value-added and the lack of consensus in the existing literature. For this purpose, after determining the stationarity of CO₂ emissions, agrarian production, per capita income, and renewable energy series used to represent environmental pollution, the relationship between these variables was examined using the ARDL model. The research concluded that renewable energy and agricultural production can reduce CO₂ emissions in the long term, whereas increases in per capita income can exacerbate them. For the period from 2000 to 2020, which constitutes the limitation of the study, it was concluded that the EKC hypothesis is not valid for Türkiye in the long term. The findings of this paper suggest that policymakers should support environmentally friendly agricultural production and encourage producers to use renewable energy to reduce environmental pollution.
Introduction
Throughout human history, various activities have caused significant direct or indirect changes in the environment, contributing to social, economic, and cultural development. In particular, the transformations that followed the Industrial Revolution have led to severe environmental degradation. Industrialisation, urbanisation, and the rising demand for energy have accelerated environmental destruction and intensified greenhouse gas emissions. Among these emissions, carbon dioxide (CO2) constitutes the largest share (Ayhan et al., 2023b; Kartal et al., 2025). Environmental sustainability, often neglected in favor of economic growth, has now become a critical global concern.
The foundation for studies exploring the relationship between economic growth and environmental pollution originates from the work of Kuznets, who examined the relationship between economic growth and income inequality. Kuznets argued that inequality increases during the early stages of economic development but declines once a certain threshold is reached, producing an inverted U-shaped relationship between growth and inequality. In the 1990s, researchers identified a similar inverted U-shaped relationship between environmental degradation and economic growth (Grossman and Krueger, 1991; Selden and Song, 1994; Shafik and Bandyopadhyay, 1992; Ayhan et al., 2023a; Panayotou, 1993). This relationship became known as the “Environmental Kuznets Curve (EKC)”.
According to the EKC hypothesis, countries pursuing economic growth initially prioritize production expansion and GDP per capita increases, often at the expense of the environment. However, once income surpasses a certain threshold, environmental degradation begins to decline. This turning point is associated with structural transformation toward knowledge-intensive industries and services, the enforcement of stricter environmental regulations, and the adoption of environmentally friendly technologies—all of which contribute to reducing ecological damage (Kartal et al., 2024). Due to the growing severity of environmental degradation, studies examining the relationship between economic growth and environmental pollution have gained importance, and the application of the EKC hypothesis in this context has become increasingly common (Acaroğlu et al., 2023; Başar and Tosun, 2021; Kaika and Zervas, 2013; Rashid Gill et al., 2018; Kartal et al., 2024).
While industrialisation is a major driver of environmental pollution, the agricultural sector also plays a significant role in CO2 emissions. The use of fossil fuels and nitrogen-based fertilizers in agricultural production contributes substantially to environmental degradation. Nevertheless, the Food and Agriculture Organization of the United Nations (FAO) has suggested that agricultural emissions can be mitigated through the use of clean energy sources.
Although the contribution of agriculture to Türkiye’s economic growth has declined over time, the sector maintains strategic importance due to its role in ensuring food security and supplying raw materials to industry. Sustainable agricultural production—achieved without environmental harm—is therefore essential. Transitioning from fossil fuel-based energy to renewable energy sources in Türkiye’s agricultural sector could effectively reduce CO2 emissions. Türkiye possesses abundant renewable energy potential, including solar, biomass, wind, geothermal, and hydroelectric resources. Advancing sustainable development is critical for the country, offering substantial social and economic benefits (Bayrakcı and Koçar, 2012).
The continued use of non-renewable energy in agricultural production, deforestation for farmland expansion, and the intensive use of fertilizers and pesticides all contribute to rising CO2 emissions. However, agricultural activities can also play a mitigating role by enabling plants to absorb and store carbon. Moreover, agriculture offers additional environmental benefits, such as nitrogen fixation, soil water retention, and flood control (Bilgili et al., 2016). Consequently, numerous studies have shown that adopting sustainable agricultural practices can reduce CO2 emissions (Burney et al., 2010; Lal, 2004). Yet, relatively few studies have directly examined the relationship between agricultural value added and environmental pollution, and the existing literature presents no consensus on this issue. Differences in country structures, income levels, agricultural practices, and data coverage periods contribute to this divergence.
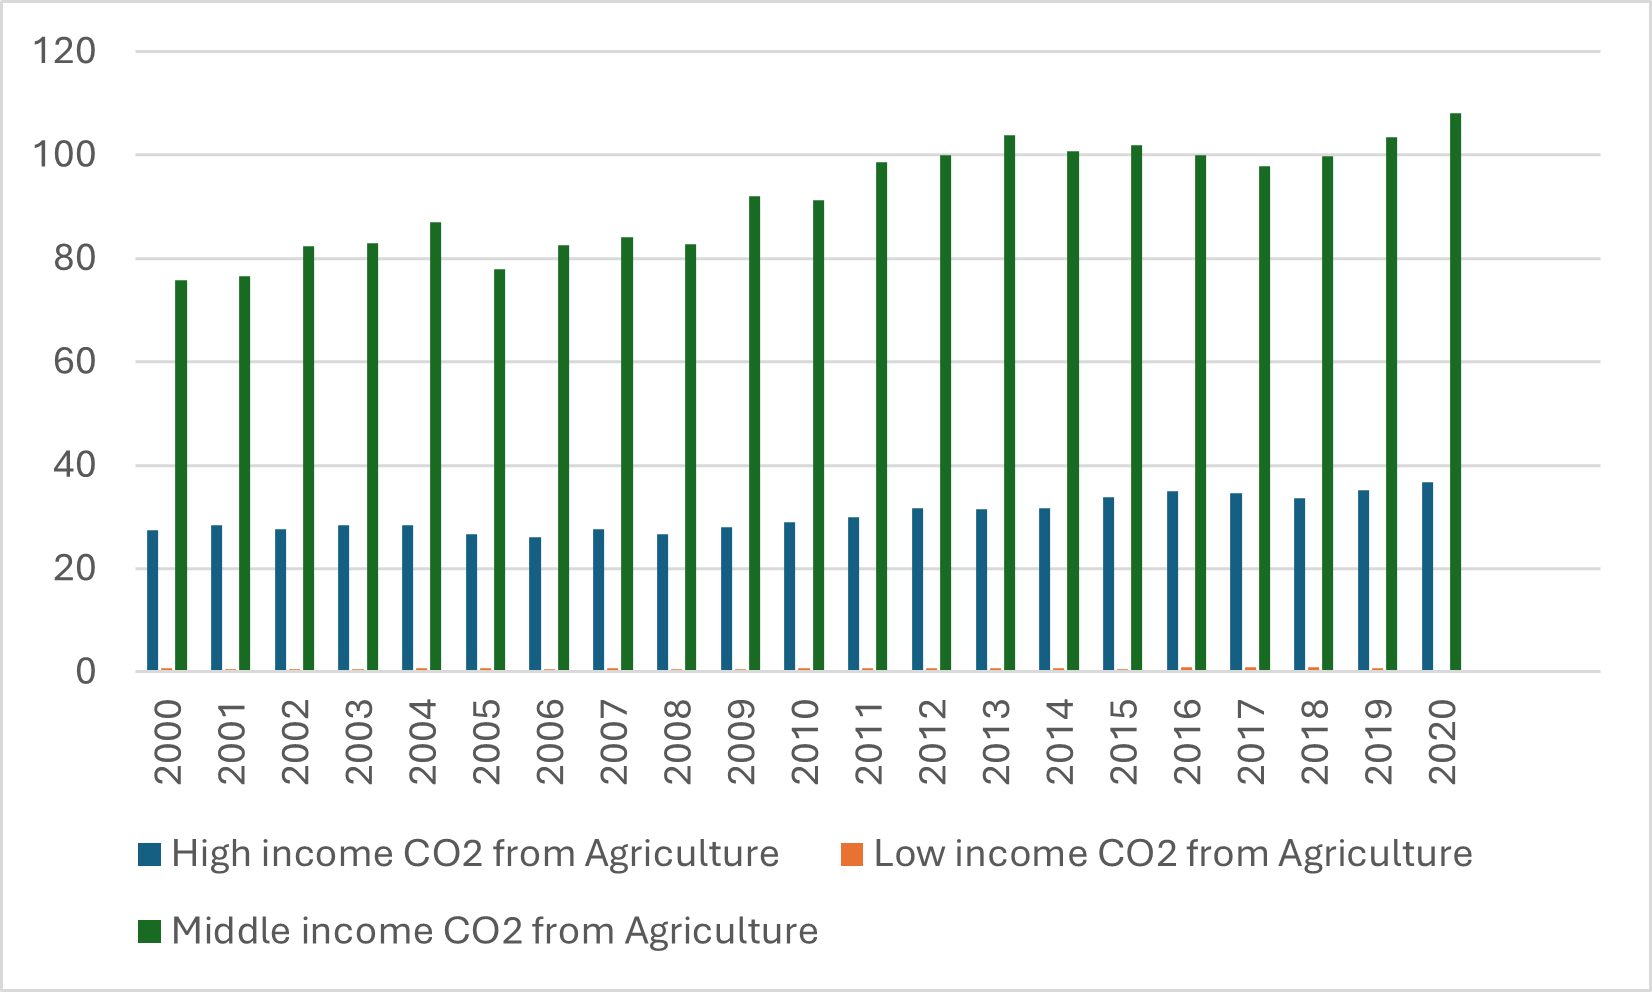
Figure displays the trend of agricultural CO2 emissions among high-, middle-, and low-income countries from 2000 to 2020. Agricultural CO2 emissions are highest in middle-income countries, and notably, they have increased since 2010. By 2020, agricultural emissions in middle-income countries reached 108 million tonnes, compared with 36 million tonnes in high-income countries. Low-income countries reported significantly lower levels, rising from 0.837 million tonnes in 2000 to 0.387 million tonnes in 2020. These figures indicate that agricultural CO2 emissions differ substantially across income groups, reflecting structural variations in agricultural production methods
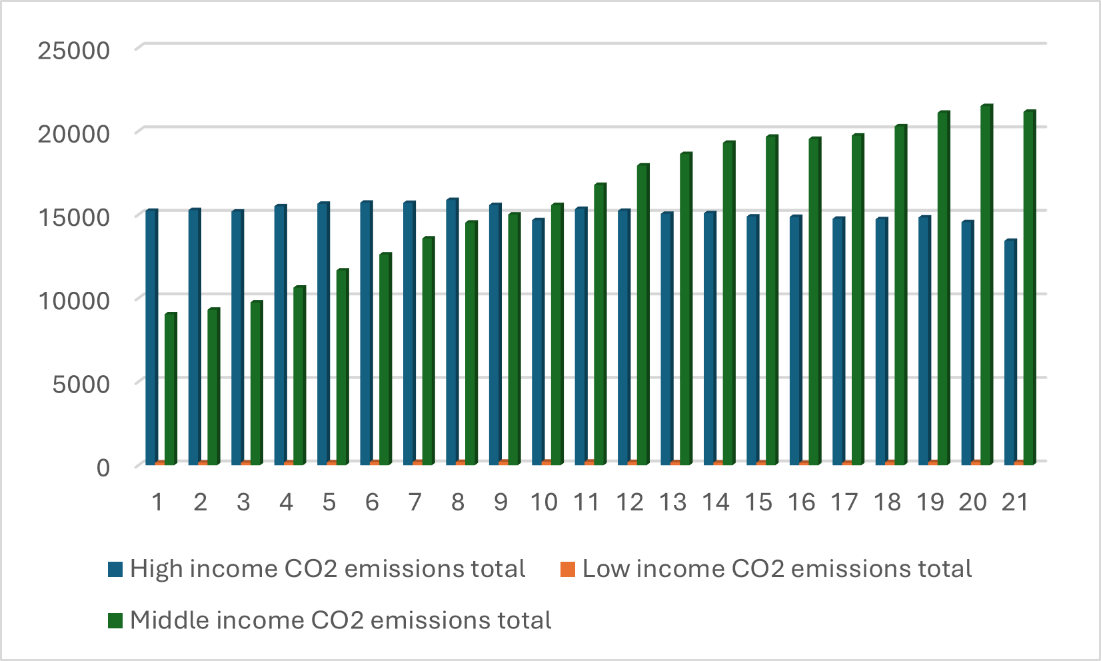
Figure shows the change in total CO2 emissions from 2000 to 2020 for different country income groups. High-income countries had the highest emissions in the early 2000s; however, after 2009, emissions from middle-income countries increased sharply, reaching 21 million tonnes by 2020 and surpassing high-income levels. Total emissions in low-income countries remained comparatively low throughout. These results suggest that the center of gravity in global CO2 emissions has gradually shifted toward developing nations. This shift may be explained by the adoption of greener technologies and sustainable energy policies in developed countries. The continued upward trend in emissions among middle-income countries, including Türkiye, represents a warning signal for environmental sustainability
Most previous studies examining the EKC hypothesis have focused on industrial and energy sectors to explore the growth–environment nexus (Hettige et al., 2000; Tan et al., 2015; Wang et al., 2022; Yilanci et al., 2023; Zhang et al., 2017). However, relatively few have investigated agriculture within this framework, and there remains no clear consensus on its role in environmental pollution. This study addresses that gap by evaluating the impact of agricultural value added on CO2 emissions within the context of the EKC hypothesis. The analysis focuses on Türkiye, emphasizing the strategic role of agriculture in developing economies in balancing growth and environmental sustainability.
Furthermore, the study examines the influence of renewable energy consumption on environmental pollution, consistent with sustainability objectives. Existing evidence supports the emission-reducing effect of renewable energy use, though the magnitude and direction of this relationship often depend on development levels and other contextual factors (Sarkodie and Adams, 2018; Ayhan et al., 2023b). Given Türkiye’s classification as a developing country, it provides a compelling case for analysis.
In the Turkish EKC literature, few studies have treated agricultural value added as a key determinant of environmental outcomes. Considering the sector’s dual economic and ecological significance, this represents a notable omission. While insights from research on renewable energy inform this study’s approach, the covariate structure adopted here departs from conventional EKC formulations. To the best of our knowledge, the EKC hypothesis has not been tested for Türkiye within a model jointly incorporating agricultural value added and renewable energy. Addressing this research gap forms the central motivation of this study, highlighting Türkiye’s distinctive position in the global sustainability landscape. With its strong agricultural capacity, ongoing energy transition, and evolving growth dynamics, Türkiye offers a particularly relevant context for this analysis.
Accordingly, this study investigates the relationship between economic growth, renewable energy use, agricultural inputs, and CO2 emissions within the EKC framework, using annual data for the period 1990–2020. The subsequent sections are structured as follows: the next section reviews the relevant literature, the following section presents the econometric methodology, and the final section discusses the empirical findings and conclusions.
Literature Review
Studies examining the relationship between environmental pollution and agriculture—the focus of this study—have produced diverse findings. Jebli & Youssef (2017a) investigated the relationship between per capita renewable energy consumption, agricultural value added, and CO2 emissions in relation to real GDP, using data from 1980 to 2011 for five North African countries. According to the results of panel Granger causality tests, a bidirectional relationship was observed between CO2 emissions and agriculture in the short run, while a unidirectional relationship existed from agriculture to real GDP and from renewable energy consumption to agriculture. In the long run, bidirectional causality was found between agriculture and CO2 emissions, along with a unidirectional relationship between renewable energy and both agriculture and CO2 emissions. Long-term parameter estimates revealed that increases in GDP and renewable energy consumption raise CO2 emissions, whereas increases in agricultural value added reduce them.
Zafeiriou & Azam (2017) examined the effect of agriculture and economic growth on CO2 emissions in France, Portugal, and Spain using the autoregressive distributed lag (ARDL) bounds testing approach. Their results confirmed the validity of the Environmental Kuznets Curve (EKC) hypothesis for all three countries.
Rafiq et al. (2016) analyzed the determinants of CO2 emissions using the STIRPAT and EKC models for 53 high-, middle-, and low-income countries covering the period 1980–2010. The model included variables such as total population, GDP per capita, industrialization rate, the share of the service sector in GDP, the share of the agricultural sector in GDP, and renewable and non-renewable energy consumption. The findings indicated that economic growth, non-renewable energy consumption, and energy intensity increase CO2 emissions, while the service and agricultural sectors help reduce pollution. Industrialization, however, was found to exacerbate environmental degradation.
Appiah et al. (2018) employed fully modified ordinary least squares (FMOLS) and dynamic ordinary least squares (DOLS) estimators to investigate developing countries over the period 1971–2013. Their analysis examined the relationship between CO2 emissions, agricultural production, population, GDP, and energy consumption. The findings revealed that economic growth enhances agricultural production, leading to increased CO2 emissions, while energy consumption and population growth were associated with declines in CO2 emissions.
Liu et al. (2017) conducted a study covering Indonesia, Malaysia, the Philippines, and Thailand from 1970 to 2013 to test the EKC hypothesis. The study examined the relationships among CO2 emissions, GDP, renewable energy consumption, agricultural value added, and non-renewable energy consumption. Long-run results provided no support for the EKC hypothesis in these countries. However, renewable energy consumption and agricultural value added were found to reduce CO2 emissions, whereas non-renewable energy consumption had a positive effect on emissions. In the short run, direct relationships were observed among CO2 emissions, non-renewable energy, agriculture, GDP, and renewable energy.
Waheed et al. (2018) analyzed the impact of renewable energy consumption, agricultural production, and forest areas on CO2 emissions in Pakistan for the period 1990–2014 using the ARDL model. Their findings showed that renewable energy consumption and forest conservation have a long-term negative effect on CO2 emissions, while agricultural production exerts a positive impact.
Parajuli et al. (2019) used dynamic panel data for 86 countries between 1990 and 2014 to explore the impact of agricultural land use and forest cover on CO2 emissions. Their results revealed that forest areas help reduce carbon emissions, whereas agricultural activities contribute to increased emissions.
Qiao et al. (2019) examined G20 countries within the EKC framework to assess the impact of agriculture, economic growth, and renewable energy on CO2 emissions. Using panel FMOLS and vector error correction model (VECM) causality analyses, they found a long-term relationship among the selected variables. The results showed that agriculture increases CO2 emissions, while renewable energy reduces them, confirming the EKC hypothesis in G20 economies.
Olanipekun et al. (2019) analyzed Central and West African countries from 1996 to 2015 using pooled mean group (PMG), mean group (MG), and augmented mean group (AMG) estimators to assess the effect of agriculture on the environment relative to income levels. Their results indicated that both agriculture and income have detrimental effects on the environment, while renewable energy use mitigates environmental degradation.
Çetin et al. (2020) focused on Türkiye during the period 1968–2016, examining the relationships among agricultural value added, agricultural land, economic growth, renewable energy consumption, and CO2 emissions using the ARDL model. Their analysis revealed that agricultural value added and agricultural land reduce CO2 emissions in the long run.
Similarly, Oğul (2023) investigated the relationship between agriculture and environmental pollution in Türkiye for the period 1990–2018 using the ARDL approach. The results indicated that in the long run, economic growth, trade liberalization, and agricultural value added increase CO2 emissions, while renewable energy consumption reduces them. The EKC hypothesis was validated for Türkiye in the long run but not in the short run.
Jebli & Youssef (2017b) also analyzed Tunisia for the period 1980–2011, investigating the relationships among CO2 emissions, GDP, renewable and non-renewable energy consumption, trade openness, and agricultural value added using VECM and Granger causality tests. The results revealed bidirectional causality between agricultural value added and CO2 emissions, as well as between agricultural value added and trade openness. Additionally, long-run causality was found among all variables. Parameter estimates showed that non-renewable energy consumption, trade openness, and agricultural value added increase CO2 emissions, while renewable energy consumption mitigates them. The EKC hypothesis, however, was not supported for Tunisia.
Ozbek & Ogul (2023) examined the period 1990–2019 for Türkiye to analyze the impact of agricultural value added, forest area, energy consumption, and GDP on the ecological footprint using ARDL, FMOLS, DOLS, and canonical cointegrating regression (CCR) models. Their findings indicated that agricultural value added, economic growth, and energy consumption increase the short- and long-term ecological footprint, whereas forest expansion reduces it.
Finally, Özbay (2024) investigated the relationship between CO2 emissions and agricultural value added, crop production index, food production index, and livestock production index in Türkiye during the period 1990–2020 using the ARDL model. The analysis showed a positive long-term relationship between the food production index and CO2 emissions, while agricultural value added, livestock production index, and crop production index were negatively associated with emissions.
Model Specification and Data
Model Specification
This study examined the relationship between agricultural production, economic growth, renewable energy consumption, and CO2 emissions in Türkiye, utilizing annual data from 1990 to 2020 within the ARDL (Autoregressive Distributed Lag) model framework. The model was specified in its logarithmic form as follows:
A multiple regression model was employed in the analysis, and various variables that could potentially affect environmental pollution were included in the model. The reason for preferring the multiple regression model is that GDP and RE have been established in the literature as the fundamental variables affecting environmental pollution. The constant term α0 in the model represents time t and the error term εt. Parameters α1, α2, and α3 represent the long-run elasticity estimates of agricultural value added, real GDP per capita, and renewable energy consumption. Because there are both positive and negative views in the literature regarding the effects of agricultural production on CO2 emissions, the α1 parameter estimates can take either positive or negative values (Qiao et al., 2019). According to the environmental Kuznets curve, an inverted-U-shaped relationship exists between GDP per capita and CO2 per capita. Therefore, the expected value of parameter α2 is positive (Grossman and Krueger, 1994). Due to the majority of evidence in the literature indicating a negative relationship between renewable energy and CO2 emissions, the estimate of parameter α3 is negative (Jebli et al., 2016).
Data
The definitions of the variables used in the study, along with the databases from which they were obtained, are presented in Table .
Table 1. Definition of the Variables Used
| Variables | Abbreviation | Period (Annual) | Source |
| CO2 Emissions (metric tons per capita) | CO2 | 2000-2020 | World Bank |
| Agricultural Value Added (constant 2015 US dollars) | AP | 2000-2020 | World Bank |
| GDP (per capita, constant 2015 US dollars) | GDP | 2000-2020 | World Bank |
| Renewable Energy (total consumption) | RE | 2000-2020 | International Energy Agency (IEA) |
Descriptive statistics for the variables are presented in Table .
Table 2. Descriptive Statistics for Variables
| Variables | LNCO2 | LNAP | LNGDP | LNRE |
| Mean | 1.283369 | 24.53187 | 8.951753 | 10.73976 |
| Median | 1.229780 | 24.47541 | 8.942239 | 10.60145 |
| Maximum | 1.649789 | 24.93743 | 9.407523 | 11.79253 |
| Minimum | 0.940928 | 24.27793 | 8.567302 | 10.03460 |
| Standard Deviation | 0.220960 | 0.203529 | 0.284479 | 0.481413 |
| Skewness | 0.030586 | 0.485490 | 0.291939 | 0.656971 |
| Kurtosis | 1.710113 | 1.910142 | 1.704680 | 2.565360 |
| Jarque-Bera | 2.153920 | 2.752016 | 2.607574 | 2.474003 |
As shown in Table , all variables are normally distributed. The graphs of the variables are shown in Figure .
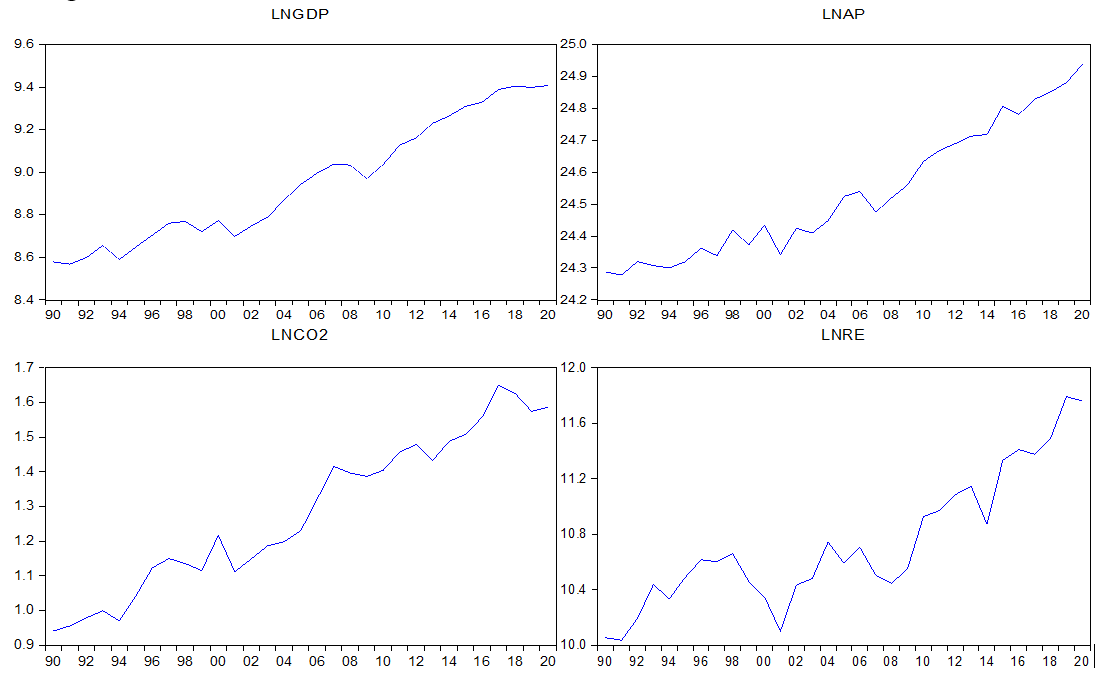
Figure illustrates that the series comprising CO2 emissions, agricultural added value, per capita national income, and renewable energy data exhibit a distinct trend
Methodology
To test the unit root level of the series in the model, the ADF (Augmented Dickey-Fuller) and PP (Phillips-Perron) unit root tests developed by Dickey & Fuller (1979) and Phillips & Perron (1988), respectively, are used. Based on the results of the unit root tests, the method is determined, and the analysis is continued. The ARDL (Auto-Regressive Distributed Lag) method, developed by Pesaran et al. (2001), is used to test the cointegration relationship between the variables in the model. The ARDL method tests the cointegration relationship in models with at least two non-stationary variables. The reason for choosing the ARDL method is that it is more flexible than traditional cointegration tests and does not require all variables to be integrated at the same level. Additionally, the ARDL method can be applied to models with small samples. An unrestricted error correction model was created for the ARDL method.
The Dummy1 variable was added to the model to control the effects of the 2001 Turkish crisis. The aim was to prevent structural breaks related to the crisis period and to increase the reliability of the estimation results.
In the equation 2, the difference operator ‘Δ’ indicates that the natural logarithms ‘ln’ are taken at the beginning of the variables, ‘εt’ denotes the error term, ‘dum1’ denotes the dummy variable, “β0” denotes the constant term, ‘β2, β3, β4, and β5’ denote the short-term coefficients, ‘α1, α2, α3, and α4’ denote the long-term coefficients, and ‘p, r, s, and t’ denote the lag lengths. The Wald test (F statistic) tests the cointegration relationship between variables in the ARDL model. The existence of the cointegration relationship is determined by comparing the F-statistic value with the critical values calculated by Pesaran et al. (2001) and Narayan (2005).
Hypotheses related to the test;
H0= α1= α2= α3 = α4= 0 (no cointegration is found) and
H1 = α1 ≠ α2≠ α3 ≠ α4 ≠ 0 (cointegration is found)
The null hypothesis (H0) is rejected when the F-statistic value exceeds the critical value; conversely, the alternative hypothesis (H1) is rejected when the F-statistic is below the critical value.
Empirical results and discussion
The null hypothesis (H0) of the ADF and PP unit root tests applied to assess the unit root properties of the series in the model assumes that the series contains a unit root. In contrast, the alternative hypothesis (H1) assumes stationarity. The unit root test results for the variables are presented in Table .
Table 3. Unit Root Test Results
| ADF | With Constant | P-value | With Constant and Trend | P-value | PP | With Constant | P-value | With Constant and Trend | P-value |
| lnCO2 | -0.826488 | 0.7969 | -3.284139 | 0.0882 | lnCO2 | -0.738860 | 0.8217 | -3.022387 | 0.1430 |
| lnAP | 1.451331 | 0.9987 | -1.368709 | 0.8489 | lnAP | 2.526235 | 1.0000 | -2.372165 | 0.3855 |
| lnRE | 1.544947 | 0.9989 | -2.066920 | 0.5425 | lnRE | 0.073989 | 0.9582 | -2.035419 | 0.5591 |
| lnGDP | 0.104610 | 0.9608 | -2.527060 | 0.3137 | lnGDP | 0.262861 | 0.9721 | -2.528517 | 0.3132 |
| 1st Difference | 1st Difference | 1st Difference | 1st Difference | 1st Difference | 1st Difference | 1st Difference | 1st Difference | 1st Difference | 1st Difference |
| lnCO2 | -5.908915*** | 0.0000 | -5.820621*** | 0.0003 | lnCO2 | -7.738657*** | 0.0000 | -7.533311*** | 0.0000 |
| lnAP | -9.244992*** | 0.0000 | -4.346202** | 0.0102 | lnAP | -9.371849*** | 0.0000 | -27.658680*** | 0.0000 |
| lnRE | -6.414866*** | 0.0000 | -3.880144** | 0.0286 | lnRE | -6.828824*** | 0.0000 | -7.199137*** | 0.0000 |
| lnGDP | -5.423586*** | 0.0001 | -5.331976*** | 0.0009 | lnGDP | -5.612814*** | 0.0001 | -5.866189*** | 0.0002 |
A general evaluation of the unit root test results presented in Table indicates that all variables in the model are stationary at their first differences. Following the unit root tests, it was concluded that testing for cointegration using the ARDL approach is appropriate. The Akaike Information Criterion (AIC) was employed to determine the optimal maximum lag length for the model. Based on this criterion, the most suitable model was ARDL (2,3,0,3). At the same time, since there is no constant or trend in the model, all effects are naturally calculated from the logarithmic levels of the variables.
Table 4. ARDL Bound Test Results
| Model | Optimum Lag Length | F-Statistic |
| CO2=f (AP, RE, GDP) | ARDL (2,3,0,3) | 7.295415 |
The calculated F-statistic value for the model (7.295415) exceeds the upper bound critical value of 3.1 at the 1% significance level; therefore, the null hypothesis (H0) is rejected, and the alternative hypothesis (H1) indicating the presence of cointegration is accepted.
Table 5. Diagnostic Tests for the ARDL (2,3,0,3) Model
| Diagnostic Tests | F-Statistic | P-Value |
| Breusch-Godfrey | 0.921371 | 0.4208 |
| Jarque-Bera | 0.877571 | 0.6448 |
| Breusch-Pagan-Godfrey | 0.405120 | 0.9392 |
| Ramsey Reset | 0.498286 | 0.4911 |
| Cusum | Stable | Stable |
| Cusum of Squares | Stable | Stable |
According to the diagnostic test results presented in Table , it was concluded that there was no autocorrelation problem, the model was suitable for a normal distribution, there was no heteroscedasticity problem, no functional form problem existed, and the estimated coefficients were stable. Figure shows the Cusum and Cusum of Squares tests confirming the stability of the coefficients
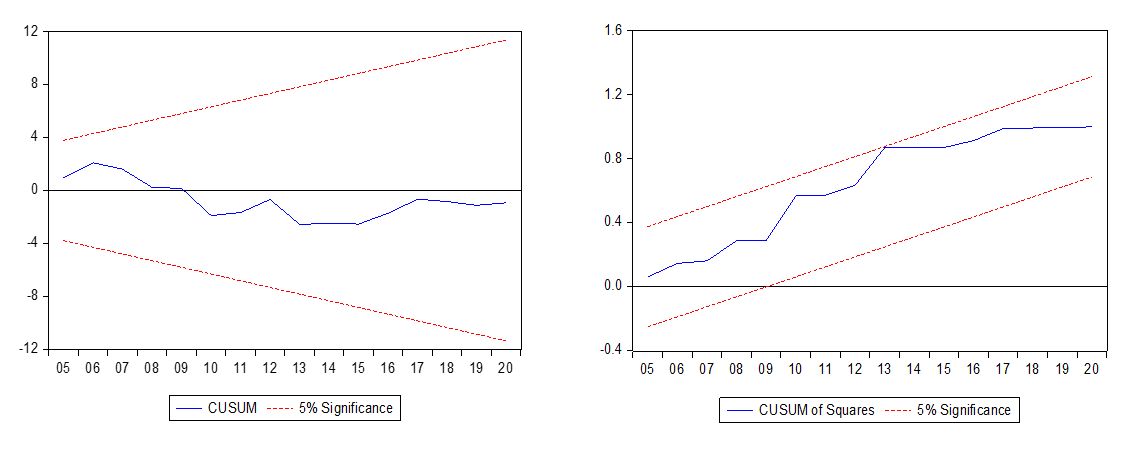
According to the CUSUM and CUSUMQ test results, the model appears to have been stable from 1990 to 2020. The test results indicate that the coefficients are stable at a 5% significance level.
Table 6. ARDL Coefficient Estimation Results
| Variables | Coefficient | P-Value |
| Short-Run | ||
| ln CO2 (-1) | 0.297728 | 0.0653 |
| lnGDP | 0.602045 | 0.0007 |
| lnGDP (-1) | -0.572412 | 0.0062 |
| lnGDP(-2) | -0.411821 | 0.0067 |
| lnAP | 0.038256 | 0.7839 |
| lnAP(-1) | 0.431388 | 0.0149 |
| lnAP(-2) | 0.466879 | 0.0103 |
| DUMMY1 | -0.091622 | 0.0096 |
| ECT(-1) | -0.705020 | 0.0000 |
| Long-Run | ||
| lnAP | -0.305018 | 0.0000 |
| lnRE | -0.155376 | 0.0071 |
| lnGDP | 1.168719 | 0.0000 |
| DUMMY1 | -0.091622 | 0.0383 |
According to the ARDL coefficient estimation results, all variables in the model are statistically significant in the long term. In the long term, agricultural value added and renewable energy are expected to reduce CO2 emissions, whereas economic growth is anticipated to increase CO2 emissions. The EKC hypothesis, which demonstrates an inverse u-shaped relationship between environmental pollution and economic development, is valid in the short term. In the short term, it is concluded that the one-period lagged effect of agricultural value-added pollutes environmental pollution. The ECT (-1) coefficient in the Table denotes the error correction coefficient. The error correction term coefficient is negative and significant. This provides additional evidence that the model is cointegrated, indicating that any imbalance in the model will be corrected in the long term.
Table 7. FMOLS Long-Run Estimation Results
| Variables | Coefficient | P-Value |
| LNGDP | 1.0730 | 0.0000 |
| LNRE | -0.0774 | 0.1060 |
| LNAP | -0.3053 | 0.0000 |
| DUMMY1 | -0.0134 | 0.8261 |
| Model Statistics | Value | |
| R-squared | 0.9659 | |
| Adjusted R-squared | 0.9620 | |
| S.E. of regression | 0.0419 | |
| Long-run variance | 0.0023 |
According to the long-term FMOLS estimation results, the renewable energy variable and the dummy1 variable were not found to be statistically significant. However, according to the ARDL coefficient estimation results, agricultural value added, and renewable energy appear to reduce CO2 emissions in a consistent manner. An examination of the model's descriptive statistics reveals that the long-term forecast results have high explanatory power. The R² value of 0.9659 indicates that the model explains a large portion of the variance in CO2 emissions from the independent variables.
Table 8. DOLS Long-Run Estimation Results
| Variables | Coefficient | P-Value |
| LNGDP | 1.1085 | 0.0000 |
| LNRE | -0.0898 | 0.3658 |
| LNAP | -0.3130 | 0.0000 |
| DUMMY1 | -0.1237 | 0.4744 |
| Model Statistics | Value | |
| R-squared | 0.9739 | |
| Adjusted R-squared | 0.9413 | |
| S.E. of regression | 0.0498 | |
| Long-run variance | 0.0036 |
The model also has high explanatory power according to the DOLS long-term estimation results. According to the DOLS long-term estimation results, GDP growth leads to an increase in CO2 emissions, while agricultural value added reduces CO2 emissions. Overall, the DOLS results support the FMOLS findings.
Conclusion
This study investigated the relationship between environmental pollution, agricultural production, per capita income, and renewable energy consumption in Türkiye between 2000 and 2020. Initially, the stationarity of the variables was examined using the ADF and PP unit root tests, which revealed that all variables were stationary at the I(1) level. After conducting diagnostic tests, the relationship between the dependent and independent variables was analyzed using the ARDL model. Within this framework, the relationship between per capita GDP and CO2 emissions was tested in accordance with the EKC hypothesis.
In the case of Türkiye, the EKC hypothesis suggests that environmental pollution initially increases with rising per capita income but eventually declines after a certain income threshold is reached. The findings of this study indicate that this hypothesis holds true in the short term but not in the long term. Although per capita income has continued to rise, environmental pollution has not declined accordingly. This suggests that Türkiye has not yet reached the income level at which pollution begins to decrease. Our results indicate that the expected “turning point” has not materialized; instead, CO2 emissions have continued to increase over the long run. This outcome is plausibly linked to Türkiye’s energy mix, which remains dominated by fossil fuels, as well as to the persistence of carbon-intensive production in the industrial and transportation sectors and the limited implementation of effective carbon-pricing mechanisms. Similar to other developing economies such as China, India, and Indonesia, Türkiye exhibits the characteristics of a transition economy in which the EKC does not hold over the long term.
The analysis further revealed that agricultural production and renewable energy—two key variables in this study—have a long-term mitigating effect on environmental pollution, consistent with prior findings in the literature (Rafiq et al., 2016; Liu et al., 2017; Çetin et al., 2020; Özbay, 2024). While no significant short-term relationship was found between agricultural production and CO2 emissions, the one- and two-period lags in agricultural production showed an increasing impact on emissions. The dummy variable representing the 2001 structural break was found to be statistically significant in both the short and long term.
Another important finding of this research is that increasing the use of renewable energy can effectively reduce CO2 emissions—a key policy objective for countries seeking to combat climate change. Renewable energy not only mitigates environmental pollution but also decreases dependence on imported energy sources. Given Türkiye’s heavy reliance on foreign energy supplies, it is essential to increase investments in renewable energy and provide incentives to encourage private-sector participation. Policies promoting renewable energy investments—such as low-interest loans, expanded credit facilities, and reduced bureaucratic barriers—would contribute to both emissions reduction and sustainable economic growth.
In the agricultural sector, expanding environmentally friendly policies and low-emission production techniques is crucial. Reducing fossil fuel consumption and encouraging the use of alternative, eco-friendly fuels should be prioritized. Likewise, financial support programs for farmers should be broadened to promote sustainable agricultural practices. Limiting the use of chemical fertilizers and encouraging the adoption of low-carbon production methods will help protect soil health and reduce CO2 emissions. Ensuring the continuity of such practices will assist policymakers in achieving their environmental and sustainability targets.
Overall, the evidence suggests that Türkiye diverges from the classical inverted-U pattern described by the EKC literature, instead following a long-run path characterized by carbon-intensive growth. Therefore, effective policy design should emphasize scaling up renewable energy investments, disseminating clean technologies in agriculture, and strengthening energy efficiency measures. Given Türkiye’s high energy import dependence, integrating carbon-reduction targets into the national growth strategy is essential for achieving sustainable development and contributing credibly to global climate mitigation efforts.
Finally, while this study focuses on CO2 emissions as the primary indicator of environmental degradation, it is important to recognize that environmental quality encompasses multiple dimensions—including air pollutants, soil contamination, water scarcity, and biodiversity loss. Future research should broaden the analytical framework to include these additional indicators and examine related factors such as resource diversity in agriculture, the diffusion of environmentally friendly technologies, soil pollution, and climate impacts. Expanding the dataset and employing diversified analytical techniques will enable a more comprehensive understanding of the complex relationship between economic growth, agriculture, and environmental sustainability in Türkiye.
Supplementary Material
Supplementary material is available online at: http://doi.org/10.51300/JSE-2025-156
Conflict of Interests
The authors declare that they have no competing interests.
Funding Statement
This research did not receive any specific grant from funding agencies in the public, commercial, or not-for-profit sectors.
Disclosure Statement
The authors certify that they have no financial or non-financial affiliations or interests—such as employment, consultancies, stock ownership, honoraria, grants, or personal/professional relationships—that could influence the work presented in this manuscript.
References
- . Testing the environmental kuznets curve hypothesis in terms of ecological footprint and co2 emissions through energy diversification for turkey. Environmental Science and Pollution Research, 30 (22), pp. 63289–63304. 10.1007/s11356-023-26278-wCrossRef | Google Scholar .
- . Asymmetric effect of economic policy uncertainty, political stability, energy consumption, and economic growth on co2 emissions: evidence from g-7 countries. Environmental Science and Pollution Research, 30 (16), pp. 47422–47437. 10.1007/s11356-023-25665-7CrossRef | Google Scholar .
- . Can technological progress, renewable and nuclear energy consumption be the remedy for global climate crises? an examination of leading oecd countries. Environmental Science and Pollution Research, 31 (1), pp. 228–248. 10.1007/s11356-023-30627-0CrossRef | Google Scholar , .
- . Environmental pollution index and economic growth: evidence from oecd countries. Environmental Science and Pollution Research, 28 (27), pp. 36870–36879. 10.1007/s11356-021-13225-wCrossRef | Google Scholar .
- . Utilization of renewable energies in turkey’s agriculture. Renewable and Sustainable Energy Reviews, 16 (1), pp. 618–633. 10.1016/j.rser.2011.08.027CrossRef | Google Scholar .
- . The dynamic impact of renewable energy consumption on co2 emissions: a revisited environmental kuznets curve approach. Renewable and Sustainable Energy Reviews, 54, pp. 838–845. .
- . Greenhouse gas mitigation by agricultural intensification. Proceedings of the National Academy of Sciences, 107 (26), pp. 12052–12057. 10.1073/pnas.0914216107CrossRef | Google Scholar .
- . Tarım sektörünün çevre kirliliği üzerindeki etkisi: türkiye ekonomisi için bir eşbütünleşme ve nedensellik analizi. Tekirdağ Ziraat Fakültesi Dergisi, 17 (3), pp. 329–345. 10.33462/jotaf.678764CrossRef | Google Scholar .
- . Environmental impacts of a north american free trade agreement. Technical report 10.3386/w3914CrossRef | Google Scholar .
- . Economic growth and the environment. Technical report 10.3386/w4634CrossRef | Google Scholar .
- . Industrial pollution in economic development: the environmental kuznets curve revisited. Journal of Development Economics, 62 (2), pp. 27–58. 10.1016/s0304-3878(00)00092-4CrossRef | Google Scholar .
- . Testing environmental kuznets curve hypothesis: the role of renewable and non-renewable energy consumption and trade in oecd countries. Ecological Indicators, 60, pp. 824–831. .
- . The environmental kuznets curve (ekc) theory—part a: concept, causes and the co2 emissions case. Energy Policy, 62, pp. 1392–1402. 10.1016/j.enpol.2013.07.131CrossRef | Google Scholar .
- . Achieving environmental quality through stringent environmental policies: comparative evidence from g7 countries by multiple environmental indicators. Geoscience Frontiers, 16 (1), pp. 101956. 10.1016/j.gsf.2024.101956CrossRef | Google Scholar .
- . How are energy transition and energy-related r&d investments effective in enabling decarbonization? evidence from nordic countries by novel wlmc model. Journal of Environmental Management, 365, pp. 121664–121664. 10.1016/j.jenvman.2024.121664CrossRef | Google Scholar .
- . Soil carbon sequestration impacts on global climate change and food security. Science, 304 (5677), pp. 1623–1627. 10.1126/science.1097396CrossRef | Google Scholar .
- . The impact of renewable energy and agriculture on carbon dioxide emissions: investigating the environmental kuznets curve in four selected asean countries. Journal of Cleaner Production, 164, pp. 1239–1247. 10.1016/j.jclepro.2017.07.086CrossRef | Google Scholar .
- . Türkiye’de tarımsal faaliyetler karbon emisyonunu etkiler mi? “ardl testinden elde edilen kanıtlar”. Türk Tarım ve Doğa Bilimleri Dergisi, 11 (2), pp. 536–546. 10.30910/turkjans.1380091CrossRef | Google Scholar .
- . Empirical tests and policy analysis of environmental degradation at different stages of economic development. International Labour Organization. .
- . The greenhouse effect of the agriculture-economic growth-renewable energy nexus: evidence from g20 countries. Science of The Total Environment, 671, pp. 722–731. 10.1016/j.scitotenv.2019.03.336CrossRef | Google Scholar .
- . Urbanization, openness, emissions, and energy intensity: a study of increasingly urbanized emerging economies. Energy Economics, 56, pp. 20–28. 10.1016/j.eneco.2016.02.007CrossRef | Google Scholar .
- . The environmental kuznets curve (ekc) and the environmental problem of the day. Renewable and Sustainable Energy Reviews, 81, pp. 1636–1642. 10.1016/j.rser.2017.05.247CrossRef | Google Scholar .
- . Renewable energy, nuclear energy, and environmental pollution: accounting for political institutional quality in south africa. Science of The Total Environment, 643, pp. 1590–1601. 10.1016/j.scitotenv.2018.06.320CrossRef | Google Scholar .
- . Environmental quality and development: is there a kuznets curve for air pollution emissions?. Journal of Environmental Economics and Management, 27 (2), pp. 147–162. 10.1006/jeem.1994.1031CrossRef | Google Scholar .
- . Economic growth and environmental quality: time-series and cross-country evidence. Vol. 904, World Bank Publications. .
- . The relationships between industrial pollution intensity and economic growth based on intensity environment kuznets curve: study on china’s pilot cities. International Journal of Sustainable Development & World Ecology, 22 (3), pp. 231–241. 10.1080/13504509.2014.994233CrossRef | Google Scholar .
- . Non-linear effects of industrial structure on urban haze pollution: a test and extension of the environmental kuznets curve. Frontiers in Environmental Science, 10, pp. 1033563–1033563. 10.3389/fenvs.2022.1033563CrossRef | Google Scholar .
- . Reinvestigation of the validity of the ekc hypothesis extended with energy: a time-varying analysis for the united kingdom. Journal of Cleaner Production, 428, pp. 139284–139284. 10.1016/j.jclepro.2023.139284CrossRef | Google Scholar .
- . Role of renewable energy and non-renewable energy consumption on ekc: evidence from pakistan. Journal of Cleaner Production, 156, pp. 855–864. 10.1016/j.jclepro.2017.03.203CrossRef | Google Scholar .

About contributors

Fatih Ayhan
Department of Economics, Faculty of Economics and Administrative Sciences, Bandırma Onyedi Eylül University, Balıkesir, Türkiye
Turkey
Hilal Önge
Department of Economics, Faculty of Economics and Administrative Sciences, Bandırma Onyedi Eylül University, Balıkesir, Türkiye
Turkey